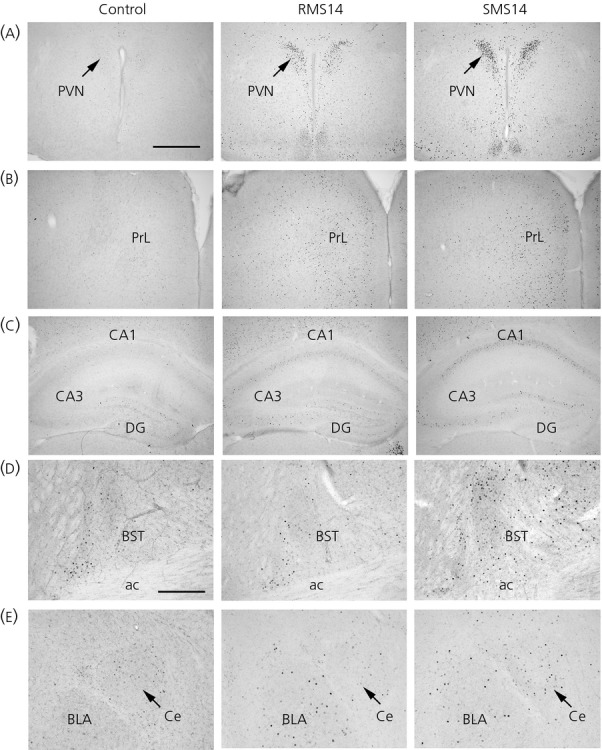
Figure 3.

Immunohistochemical images of c-Fos expression after maternal separation (MS) on postnatal day 14. (a–e) Representative immunohistochemical images of c-Fos expression in nonseparated control (left), repeated MS (RMS) 14 (centre) and acute/single time MS (SMS) 14 (right) mice in the paraventricular nucleus (PVN) (a), prelimbic cortex (PrL) (b), hippocampal CA1 (CA1), hippocampal CA3 (CA3) and dentate gyrus (DG) in the hippocampus (c), bed nucleus of stria terminalis (BST) (d), and basolatera region of the amygdala (BLA) and central amygdaloid nucleus (Ce) in the amygdala (e). ac, anterior commissure. Scale bars = 500 (a–c), 250 μm (d, e). For abbreviations, see Table 1.
