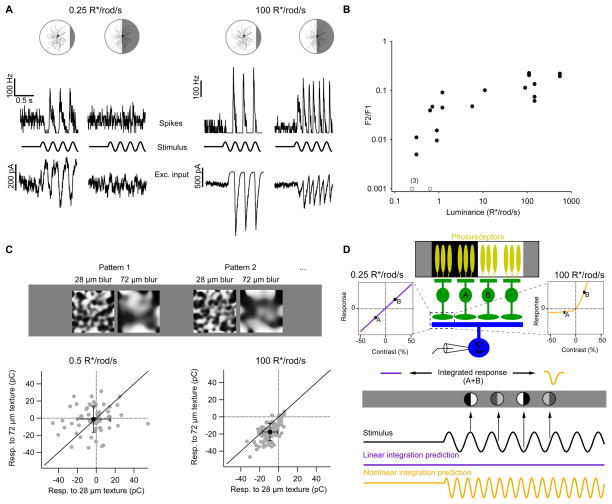
Figure 1. The computation of a retinal ganglion cell changes with luminance.
A, Spike rates (top traces) and excitatory input currents (bottom traces) recorded from On alpha ganglion cells responding to sinusoidally modulated split-field stimuli at 0.5 R*/rod/s and 100 R*/rod/s. Spikes and input currents were recorded from the same cell, and a different cell was recorded at each luminance. B, Power of the frequency doubled (F2) response divided by that of the F1 response as a function of background illumination (see Experimental Procedures). C, Top, examples of textured stimuli from the same random seed with different levels of blurring used in this experimental paradigm (see Experimental Procedures). Bottom, individual responses (gray points) to texture patterns presented at two different levels of blur for the same RGC at two different luminance levels. Solid line is unity. Mean ± standard deviation are shown in black. D, Top, schematic of RGC’s spatial summation of input from multiple presynaptic bipolar cells in response to a sinusoidally-modulated split-field stimulus. Bottom, the predicted response to sinusoidal modulation of a split-field stimulus depends on the contrast response function of the bipolar cell to ganglion cell synapse. All recordings are from whole mount preparations.

