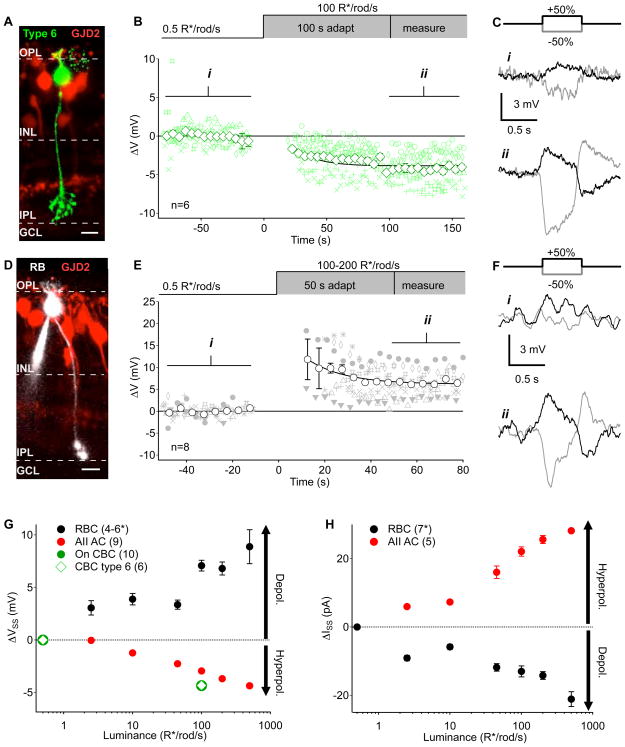
Figure 5. Steady-state voltage changes in the rod and On cone bipolar circuits as a function of luminance.
A, Example of a type 6 On cone bipolar cell reconstructed post-recording in the GJD2-GFP line (Siegert et al., 2009). Scale bar = 10 μm. B, Changes in mean voltage recorded from type 6 On cone bipolar cells before and after a step-wise increase in luminance from 0.5 to 100R*/rod/s. Smaller green symbols are measurements from individual cells (different symbol for each cell) during 1 s preceding a contrast step. Open diamonds are means (error bars are s.e.m.) across cells (n = 6 cells). C, Mean responses to positive (black) and negative (gray) contrast steps from an example cell over the time periods indicated in (i) and (ii). D, Example of a rod bipolar cell reconstructed post-recording in the GJD2-GFP line. Scale bar = 10 μm. E, Changes in mean voltage in rod bipolar cells (n = 8 cells) as in B. F, Example rod bipolar cell contrast responses as in C. G, Current clamp measurements of changes in resting membrane potential (relative to 0.5 R*/rod/s) in rod bipolar cells, AII amacrine cells, and On cone bipolar cells as a function of luminance (as in B,E). Each bipolar cell was only tested at two luminance levels (0.5 R*/rod/s and one other level) to minimize the effects of washout. For rod bipolar cells n is 6, 6, 6, 4, 5 and 4 for the test luminance levels in ascending order. H, Changes in the steady-state holding current (relative to 0.5 R*/rod/s) measured in rod bipolar cells and AII amacrine cells at different luminance levels. Numbers in parentheses indicate number of cells. All error bars represent s.e.m. Recordings are from slice preparations except for the AII amacrine cell data in G which includes data from slice and whole mount (see Supplemental Figure 2G).

