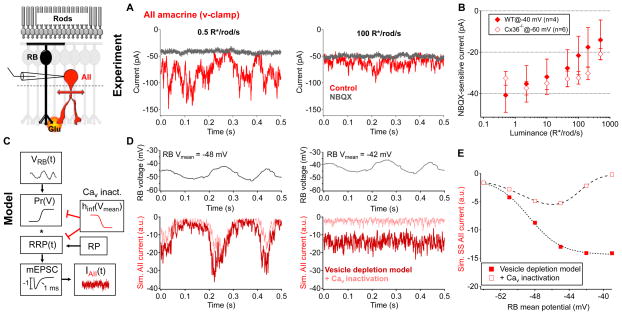
Figure 6. Tonic excitatory transmission at the rod bipolar cell → AII synapse decreases as luminance increases from 0.5 to 500 R*/rod/s.
A, Example current traces from the same AII amacrine cell under steady background illumination of 0.5 R*/rod/s and 100 R*/rod/s in the presence or absence of NBQX (10 μM). B, NBQX(10 μM)-sensitive holding current in AII amacrine cells across luminance in WT (held at −40 mV, n = 4 cells, solid diamonds) and Cx36−/ − (held at −60 mV, n = 6 cells, open diamonds) retinas. Error bars represent s.e.m. across cells. C–E, Stochastic release model of synaptic transmission at the rod bipolar cell → AII synapse (see Experimental Procedures for model details). C–D, Time-varying rod bipolar cell voltage record (model input) were passed through a stochastic synaptic release model; the model included time-dependent vesicle depletion from and replenishment to a readily releasable pool (RRP, red trace) and the addition of presynaptic calcium channel inactivation (pink trace, from Jarsky et al., 2011). The mean voltage of the rod bipolar cell example trace was varied (−54 to −39 mV, 3 mV increments). RP = reserve pool, mEPSC = miniature excitatory postsynaptic current. D, (left)At more hyperpolarized potentials (ex. −48 mV) calcium channel inactivation contributes very little to tonic glutamate releasefrom rod bipolar cells. (r ight) At more depolarized potentials (ex. −42 mV), calcium channel inactivation suppresses tonic glutamate release. E, Steady-state glutamate release/model output as a function of presynaptic resting membrane potential. All data are from slice preparations.

