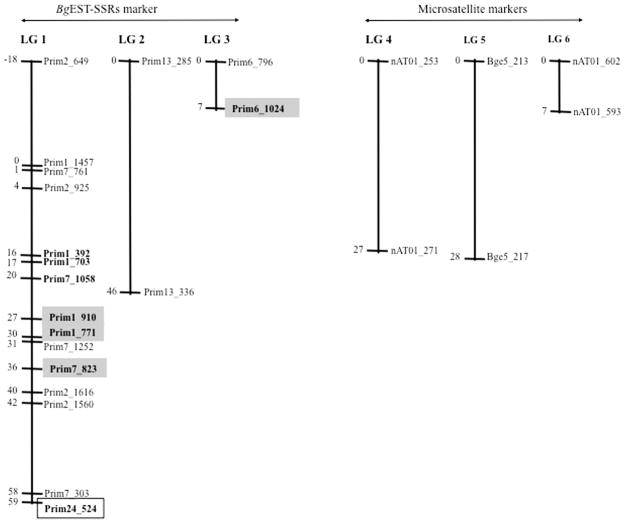
Fig. 3.
Genetic linkage map constructed using a F2 population obtained from two families of the interspecific cross: BS-90 × NMRI snails. Linkage groups were arranged by JoinMap v.3 software. Positions of loci are given in centiMorgans (Kosambi, 1944). Fragment sizes (in bp) are given as the end of the marker names. The markers in bold within the gray and white boxes indicate markers that related to resistant and susceptible loci, respectively. BgEST-SSR, Biomphalaria glabrata expressed sequence tag simple sequence repeat.

