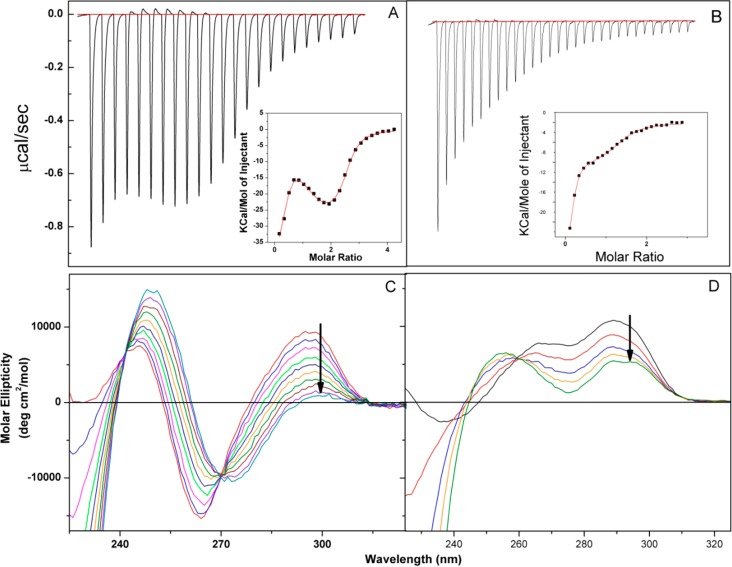
Figure 3.
Isothermal titration calorimetry (ITC) binding isotherms for the interactions of UP1 with the Tel-22 (Na+ form) G-quadruplex (A) and the Tel-22 (K+ form) G-quadruplex (B). Both the raw heat rate and the integrated heat data are shown along with the nonlinear regression fit (red). The titrations were conducted in Tris buffer [0.02 M Tris-HCl (pH 8.0) and 0.1 M NaCl (Na+ form) or KCl (K+ form)] at 25 °C. The solid lines (red) drawn through the data points in the insets represent the best fits for a three-event model (Na+ form) in panel A and a two-event model (K+ form) in panel B. Thermodynamic parameters for these binding processes are listed in Table 1. The bottom panels (C and D) show the concomitant CD spectra for the titration of the Tel-22 G-quadruplex with UP1 (the Na+ and K+ forms for panels C and D, respectively). In Panels C and D, the molar ratio (r) of UP1 to G-quadruplex spans the range of 0–2.5. The black arrows represent the directionality of the change in ellipticity at 295 nm with increasing concentrations of UP1.

