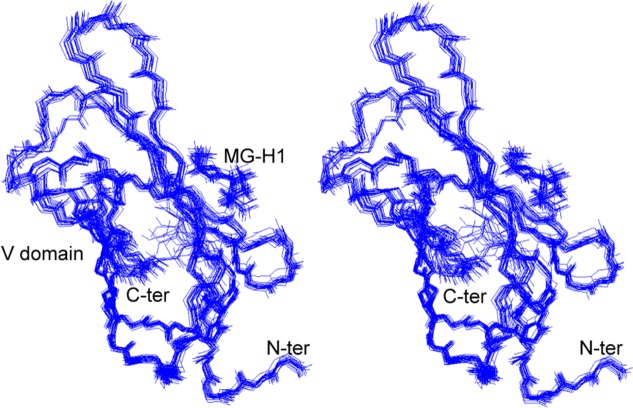
Figure 4.
Stereo overlay of the 20 lowest-energy MG-H1–V domain complex backbone traces. The Ramachandran plot shows 84.4% of the residues in the most favored regions, 14% of the residues in additional allowed regions, and only 1.6% of the residues in generously allowed regions. The rms deviations of the solution structure of the V domain (PDB entry 3CJJ) and MG-H1 are 0.84 and 0.72 Å for the backbone and 1.7 and 0.7 Å for all heavy atoms. The N- and C-termini of the V domain and MG-H1 are indicated. The figure was prepared by using SwissPDB.

