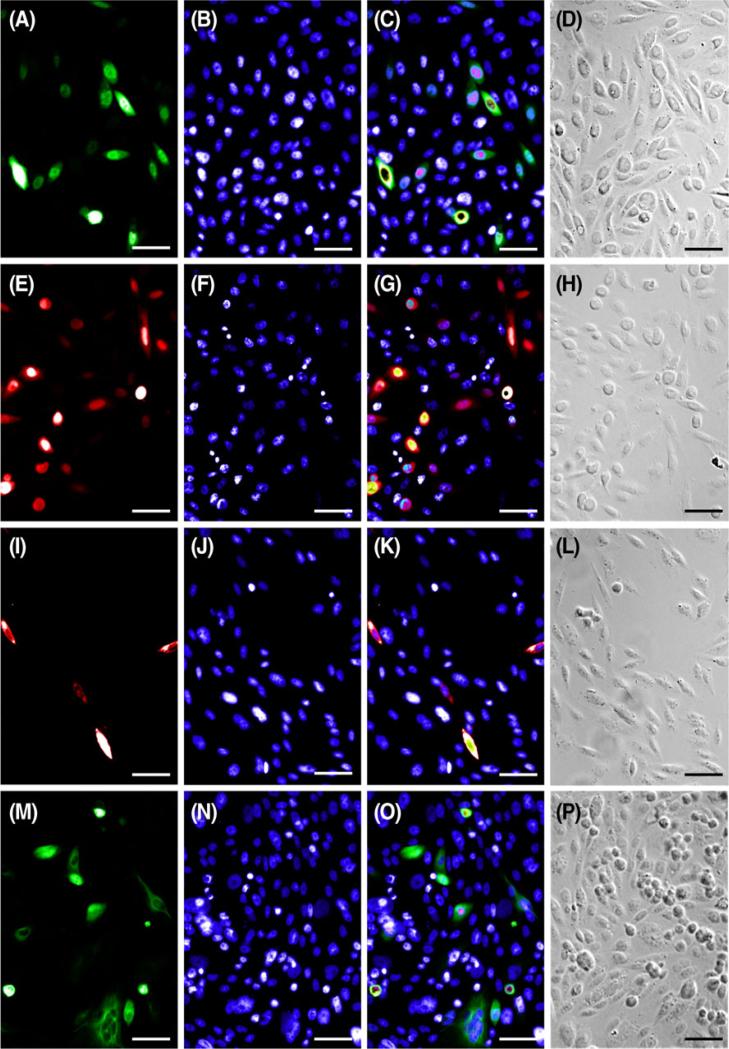
Figure 5. Lipid-mediated transfection in CHO cells.
Representative images of CHO cells used to calculate lipid-mediated transfection efficiencies. Cells transfected with pEGFP-N3 (A), pmCherry-N1 (E), pmCherry-N1 BK β1(I), and EYFP-tub (M) were counterstained with Hoechst (B, F, J, N) to calculate efficiency. Fluorescent merges (C, G, K, O) and DIC images (D, H, L, P) show that fluorescent labels localize to cells as predicted. Scale bar=50 μm.

