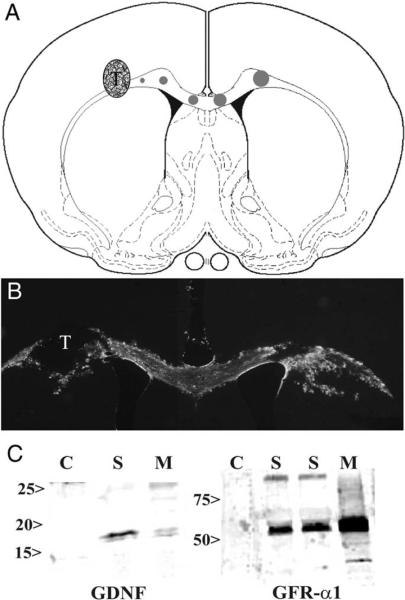
Fig. 1.
A: Diagram showing locations for adenovirus injections and VM transplant. Circles along the corpus callosum show different pathways of Ad-GFP, Ad-GDNF, or Ad-GDNF/GFRα1 from left to right. The circle size represents the volume injected, ranging from 0.4 μl (smallest circle) increasing by 0.2 μl for consecutively larger circles to the final volume of 1.2 μl (largest circle). VM transplant (T) is the stippled circle within the corpus callosum just left of the smallest circle. B: GFP expression along the corpus callosum of the GFRα1 adenovirus coexpressing a GFP reporter. The VM transplant (T) is shown within the non-GFP region on the left side of the corpus callosum. C: Western blot analysis of U373 astrocytoma cell line transfected with adenovirus encoding GDNF or GFRα1. Blots show no expression in GFP transfected controls (C). Protein was identified in tissue culture supernatants (S) and cell monolayers (M).

