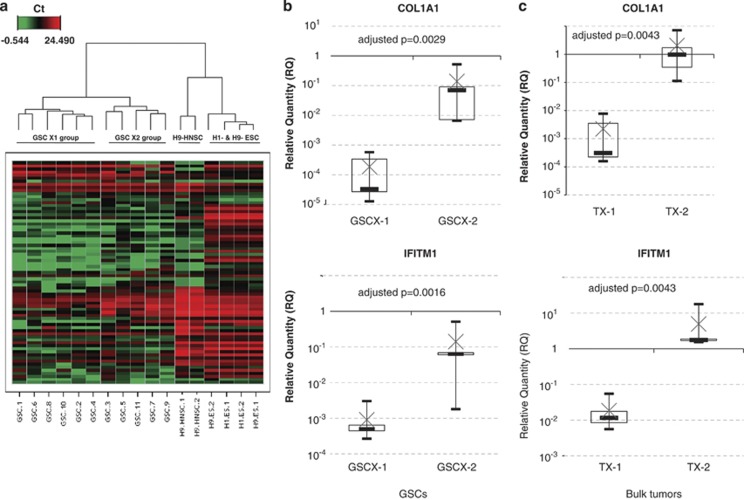
Figure 2.
Hierarchical clustering analysis of GSCs. (a) The unsupervised clustering using Ward's linkage method and Euclidean distance individualized H9 HNSCs, H1-H9-ESCs and two groups of GSCs (GSCX-1 and GSCX-2). Note that culture conditions of H9 HNSC do not influence the expression of pluripotency gene samples H9 HNSC-1 and H9 HNSC-2 samples. (b) Box plot representation of COL1A1 and IFITM1 expression levels between GSC groups GSCX-1 and GSCX-2. The charts show the log10 expression of relative quantification (RQ) values normalized to the expression of H9 HNSC cell line. (c) Box plot representation of COL1A1 and IFITM1 expression levels between bulk tumor groups TX-1 and TX-2. The top edge of the boxes represents the 75th percentile, the bottom edge, the 25th percentile and × the mean. The range is shown as vertical edge.

