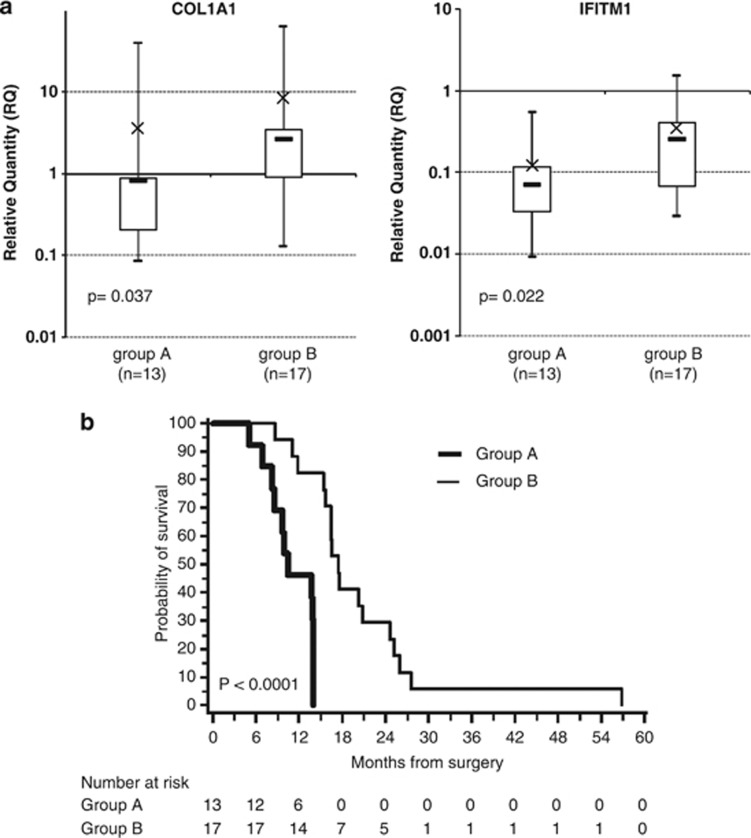
Figure 5.
COL1A1 and IFITM1 expression levels in an independent cohort of 30 patients' tumors. (a) Box plot representation of the mRNA expression levels. The charts show the log10 expression of relative quantification (RQ) values normalized to the expression of H9 NSC cell line. The top edge of the boxes represents the 75th percentile, the bottom edge, the 25th percentile and × the mean. The range is shown as vertical edge. (b) Kaplan–Meier analysis for overall survival of an independent cohort of 30 GBM patients. Survival distribution of patients with low (group A; n=13) versus high (group B; n=17) expression of COL1A1 and IFITM1 (P<10−4).

