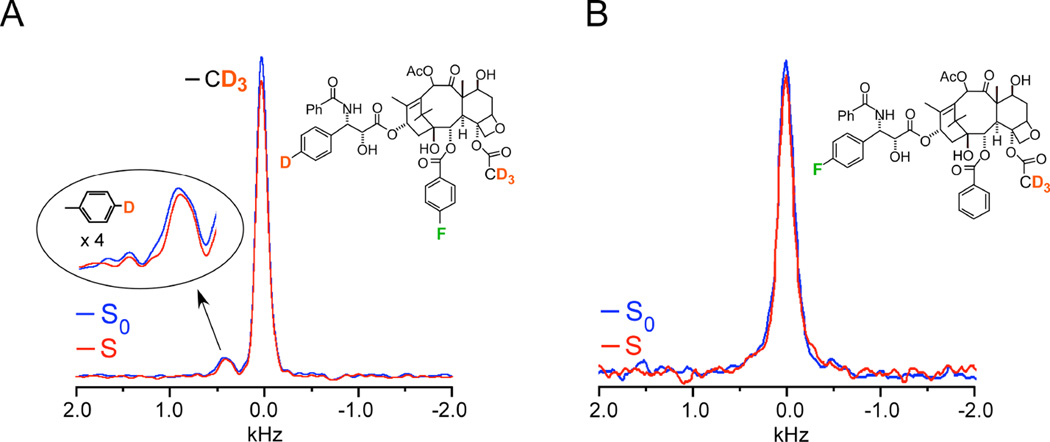
Figure 3. A 7.8 Å 2H-19F distance in taxol.
(A) 2H{19F} 64-Tr REDOR spectra of tubulin-bound taxol analogue 4, corresponding to 8 ms dipolar evolution time with MAS at 8 kHz, resulted in 8 % dephasing and a calculated distance of 7.8 (± 0.5)Å. The full-echo spectrum is shown in blue, and the dephased spectrum in red. The time domain signals were detected synchronously with the rotor so that all sidebands have been folded into the centerbands. The CD3 peak is assigned zero frequency and the aromatic-D peak appears about 5 ppm to low field. Each spectrum resulted from the accumulation of 640,000 scans with a 1.5 sec recycle delay (approximately 11 days each and, thus, days for the ΔS spectrum). (B) 2H{19F}32-Tr REDOR spectra of tubulin-bound taxol analogue 5, corresponding to 4 ms dipolar evolution time with MAS at 8 kHz, resulted in 6 % dephasing and a calculated distance of 6.3 (± 0.5)Å. Each spectrum resulted from the accumulation of 1,056,000 scans (18 days each and, thus, 36 days for the ΔS spectrum). Spectra were obtained on a 500 MHz spectrometer. Figure adapted from Paik et al.18

