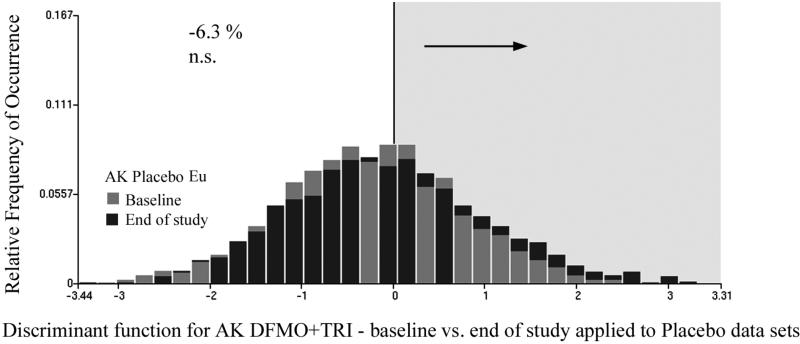
Fig.4.
The discriminant function shown in Fig.3 applied to the placebo data set, at baseline and end of study. The placebo treatment results in only an insignificant reduction of the proportion of nuclei assigned to the baseline data set, at end of study.

