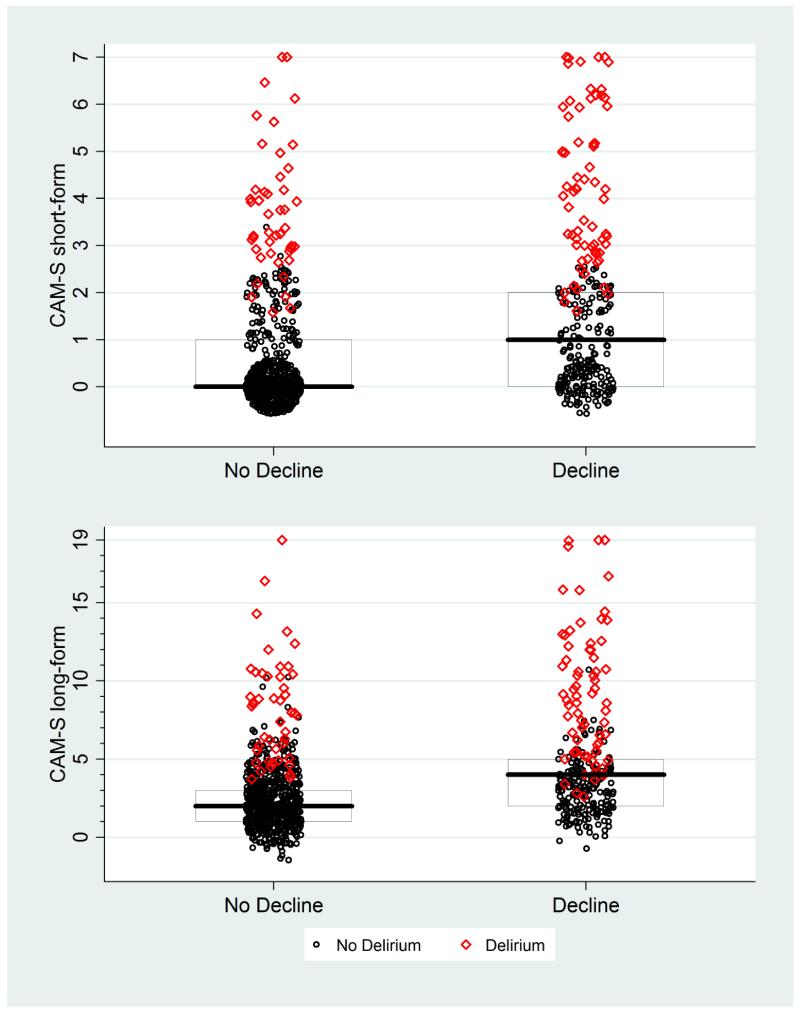
Appendix Figure 4. CAM-S Scores by Functional Decline*.
* The maximal CAM-S score during each patient’s hospitalization was used in all analyses. Functional decline was defined as a decline of 2 or more points of 14 points in activities of daily living between baseline and discharge scores (see text for details). Boxes around the plots represent the median, 25th, and 75th percentiles. If a box is not shown, that indicates the median, 25th and/or 75th percentile all had the same value.

