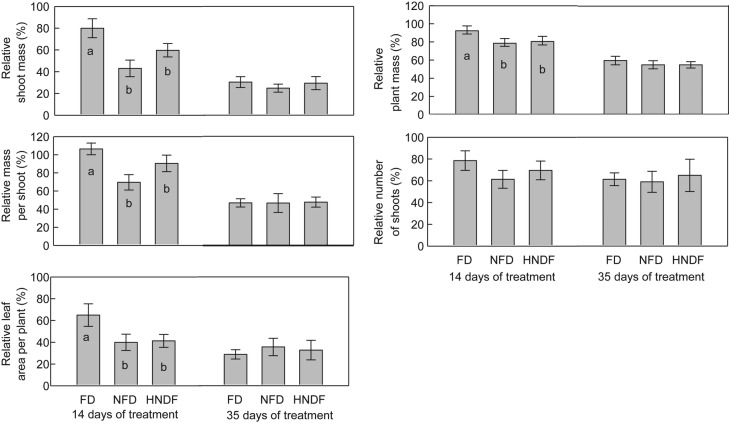
Figure 5.
Shoot mass per plant, total plant mass, mass per shoot, number of shoots per plant and leaf area per plant expressed as a proportion of the value achieved by the fully watered controls (relative value) at 14 and 35 days after the initiation of treatments. Cultivars were grouped into fall dormant (FD), non-fall dormant (NFD) and highly non-fall dormant (HNFD) fall dormancy groups based on their level of fall dormancy identified in the fall dormancy screening test. Bars with different letters were identified as being different from each other using ANOVA with non-orthogonal contrasts (P < 0.05). Error bars represent the standard errors of the mean (n = 4 to 16).

