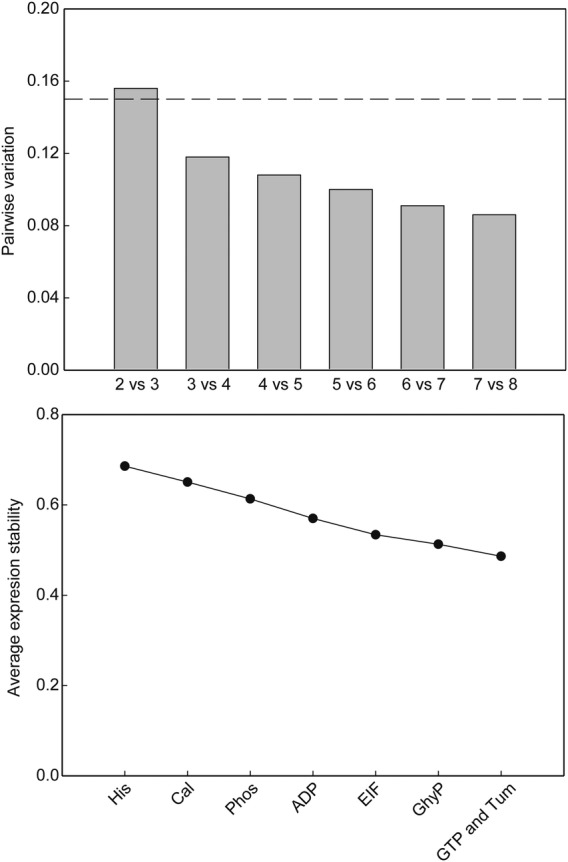
Figure 8.

Results of pairwise variation analysis (upper panel) and average expression stability calculations (lower panel) undertaken using GeNorm from the quantitative PCR of alfalfa gene transcripts using primers designed for eight potential reference genes (Phos, phosphoprotein phosphatase type 2A; His, histone H3; Cal, calmodulin; ADP, ADP-ribosylation factor; EIF, elongation initiation factor; GhyP, glyceraldehyde-3-phosphate dehydrogenase; GTP, GTP-binding protein; and Tum, translationally controlled tumour protein). The broken horizontal line on the upper panel represents the 0.15 suggested cutoff for determining the optimum number of reference genes required for normalization.
