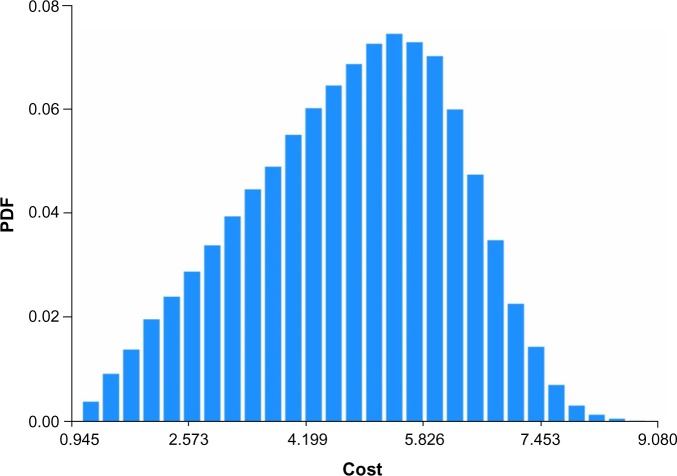
Figure 5.
Output distribution for annual total cost (billion USD) of ESA and IV iron, assuming base rate values and 500,000 patients per year.
Notes: Median value of distribution is 5.127 (3.664–6.260) billion USD. No reductions to ESA or IV iron costs were assumed for ferric citrate usage. Distribution derived from 15,000 realizations.
Abbreviations: ESA, erythropoietin-stimulating agent; IV, intravenous; PDF, probability density function.

