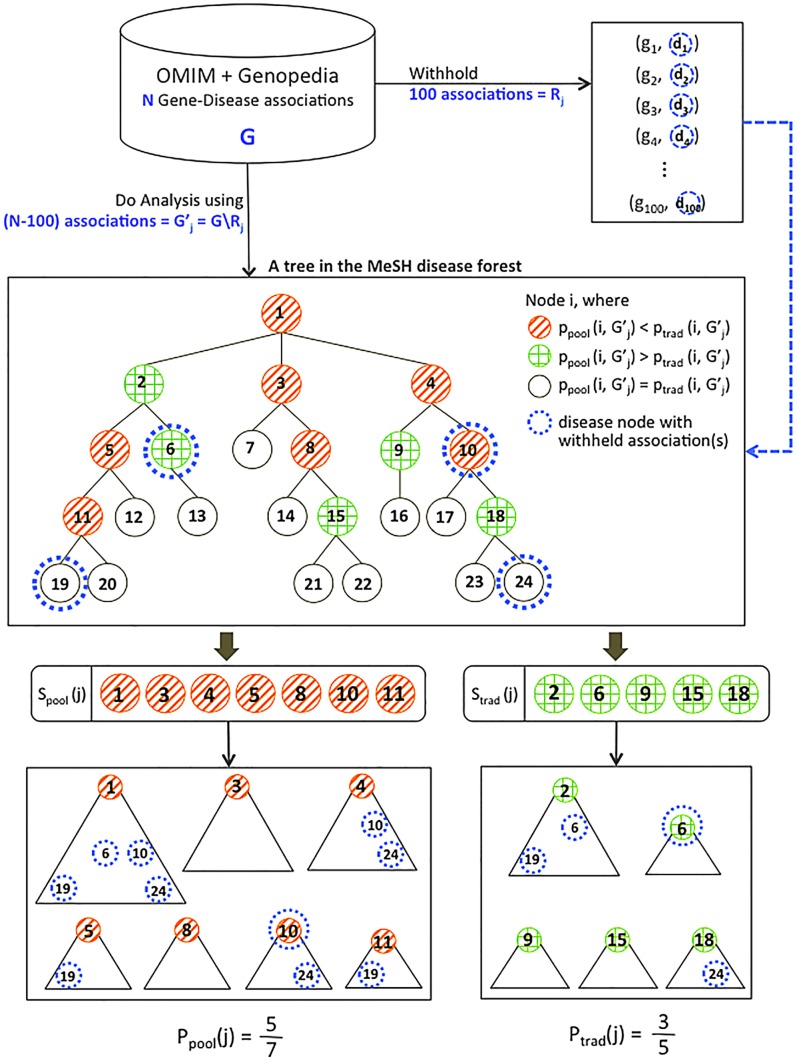
Figure 7. Example of comparison between pooling approach and traditional approach.
Illustration of the process for calculating  and
and  for the
  th random trial. 100 gene-disease associations involving genes in the query gene set are withheld. Using the remaining associations, p-values for enrichment of the disease gene set at each node are computed using both the traditional and pooling approaches. Nodes are assigned to
  or
or  based on which approach shows more significant enrichment, and the rate at which each set is supported by withheld links is computed. The idea is that if a disease class is correctly linked to the query gene set, it should be more likely to be supported by withheld gene-disease associations from that same query set.

