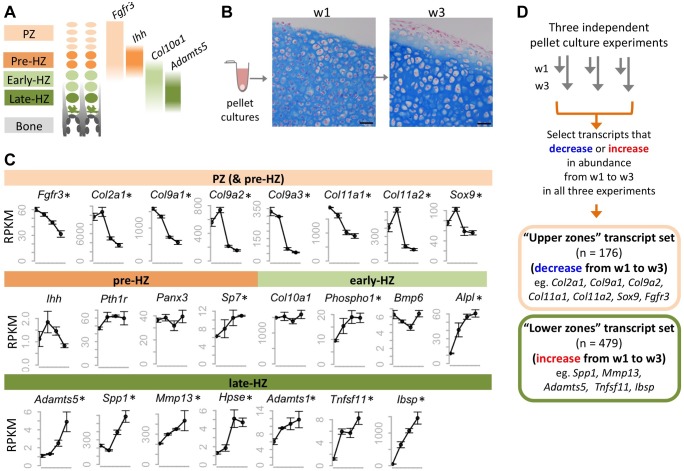
Figure 1. Identifying transcripts associated with the maturation of wild-type chondrocytes in pellet cultures.
A: Schematic representation of the zones of maturation in the growth plate. Examples of four transcripts that are associated with specific maturation states are indicated. PZ: proliferative zone. HZ: hypertrophic zone. B: Photomicrographs of Alcian Blue and Nuclear Fast Red stained sections through chondrocyte pellets after 1 week (w1) and 3 weeks (w3) in culture (scale bar = 50 µm). Note the overall increase in chondrocyte size between w1 and w3, consistent with chondrocytes undergoing hypertrophy. C: Graphs showing the abundance (RPKM) of selected transcripts in wild-type chondrocytes after 4 days, or 1, 2 or 3 weeks in pellet culture. Above each graph, the growth plate zones in which transcripts have previously been shown to be most abundant are indicated. RNA-seq was performed on 3 pellets per time point, and the average RPKM at each time point is indicated (± 1 SD). Transcripts that significantly (p<0.05) increase or decrease in abundance over time are indicated with an asterisk. D: Flow Chart showing the method used to define a set of transcripts that consistently decreased or increased in abundance over time in three independent experiments.

