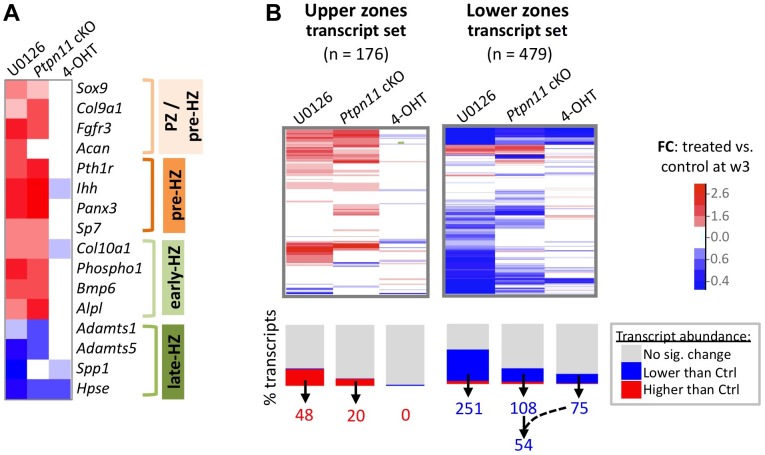
Figure 3. SHP2 depletion or MEK1/2 inhibition increases the abundance of PZ, pre-HZ and early-HZ transcripts, and decreases the abundance of late-HZ transcripts.
A: Heat map showing the fold change in abundance (treated vs. control pellets at w3) of selected transcripts that are associated with a specific stage of chondrocyte maturation. B: Heat maps showing the fold change in abundance (treated vs. control pellets at w3) for all transcripts that we included in the “upper zones” and “lower zones” transcript sets. The graph below the heat map indicates the percentage of transcripts for which the increase (red) or decrease (blue) in abundance was significant (p<0.05). The number of “upper zones” transcripts that increased in abundance in treated pellets (red), and the number of “lower zones” transcripts that decreased in abundance in treated pellets (blue), is indicated below. For Ptpn11 cKO pellets, of the 108 “lower zones” transcripts that significantly decreased in abundance, 54 did not significantly change in wild-type pellets treated with 4-OHT.

