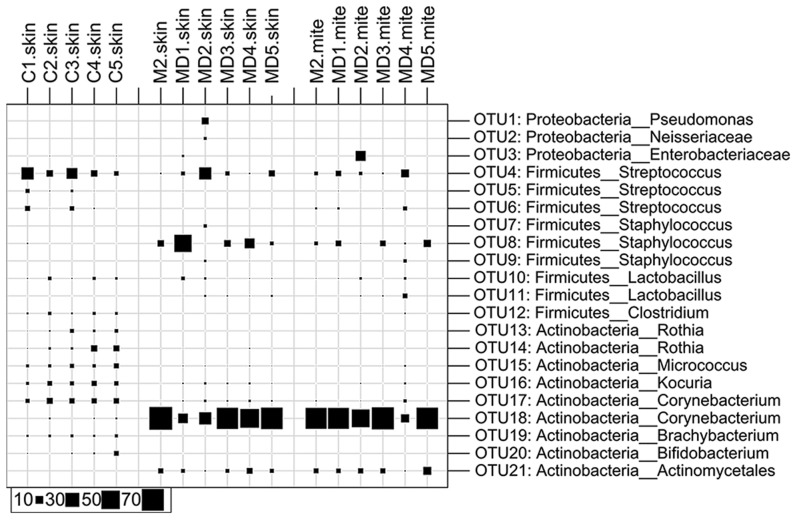
Figure 5. Microbial composition of skin samples and isolated scabies mites collected from severely scabies infested crusted sites (week 10) and control animals.
Bubble plot of the taxonomic profile as calculated for the OTU level. Only OTUs with a relative abundance of ≥2% in at least one sample are shown. Each OTU is denoted with the taxonomic classification according to the RDP Classifier (confidence value ≥0.6). The taxonomic composition between the healthy skin and the mite containing skin as well as the washed mites is differing mainly based on the relative abundance of Corynebacteria.

