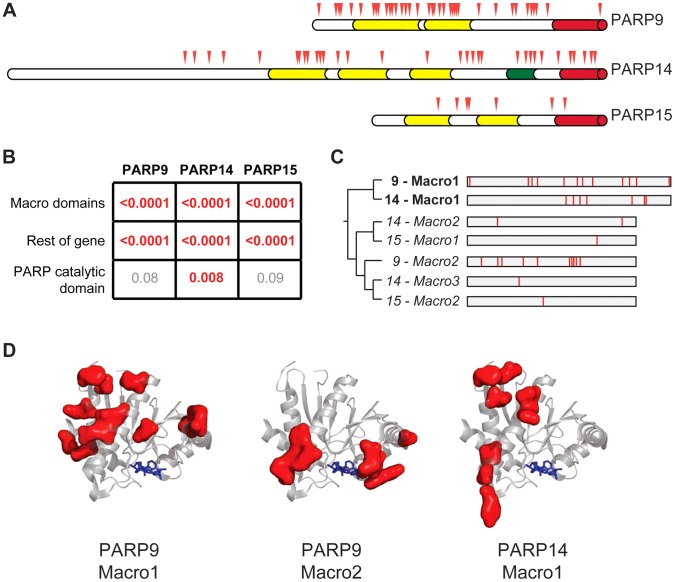
Figure 3. Widespread distribution of positive selection in macro-PARP genes.
(A) The domain structure of each macro-PARP gene is shown with domain colors as in Figure 1A. Codons evolving under recurrent positive selection are marked with red triangles as in Figure 2 (see also Tables S6-S8). (B) P–values derived from PAML tests of positive selection on all sequenced macro-PARP orthologs using either macrodomains alone, the entire gene minus the macrodomains or just the catalytic domain. Values in red indicate strong evidence of positive selection, while those in grey indicate a lack of statistically significant evidence for positive selection. (C) Phylogenetic tree of individual macrodomains from macro-PARPs, rooted using human MacroD2 as an outgroup. Macrodomains in italics lack a C-terminal extension found in most macrodomains and lack one or more of the putative catalytic motifs required for ADP-ribosylhydrolase activity [16] (Figure S5). This suggests these macrodomains may be able to recognize, but are unlikely to catalyze removal of, ADP-ribosylation. To the right is a schematic of each macrodomain with positively selected residues indicated in red (posterior probabilities greater than 0.95) (see also Alignment S3). (D) Location of positively selected sites in PARP macrodomains mapped on to the structure of the first macrodomain from PARP14 in complex with ADP-ribose (PDB code: 3Q6Z)[48]. ADP-ribose is shown as blue sticks. Residues shown as red surfaces are those that have evolved under positive selection in the indicated macrodomain.

