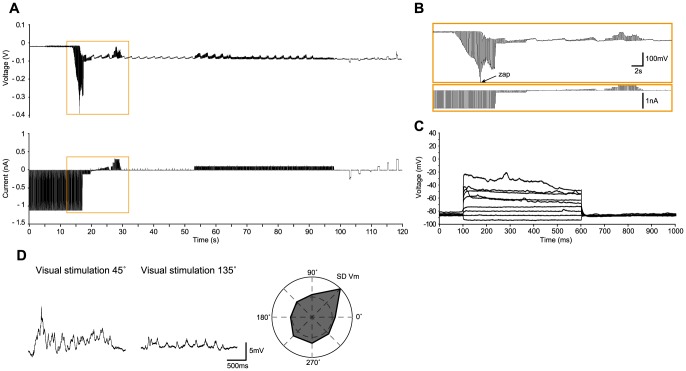
Figure 5. Glial cell in cat visual cortex in vivo recorded with the TZ method.
(A–B). As in Figure 2, voltage and current recordings during the approach to the cell, the “touch” (at ∼33 seconds), release of pressure with immediate seal formation, the first “zap” about two seconds later. The current was reduced to 100 pA about one second later, and final whole-cell access was achieved by a small suction. As for neurons (e.g. Figures 2 and 3), the “zap” is distinguished by the sudden reduction in resistance while the strong hyperpolarizing current pulses are applied. (C) Voltage responses to current steps (100 nA increments from −100 to 700 nA), showing the lack of spikes and a fast membrane time constant that are characteristic of glial cells. (D) Left - Preferred (45°) and non-preferred (135°) current clamp responses (average of 10 trials) to a moving sinusoidal grating (4 Hz, 100% contrast, 2 second duration). Right – Average standard deviation of the visual responses (over the 10 trials) as a function of stimulus direction, showing that the membrane voltage fluctuations of this cell are tuned to stimulus direction. The Ra estimated on-line was 45 MΩ (validated off-line), and the cell input resistance was 105 MΩ, thus a relative Ra of 0.43.

