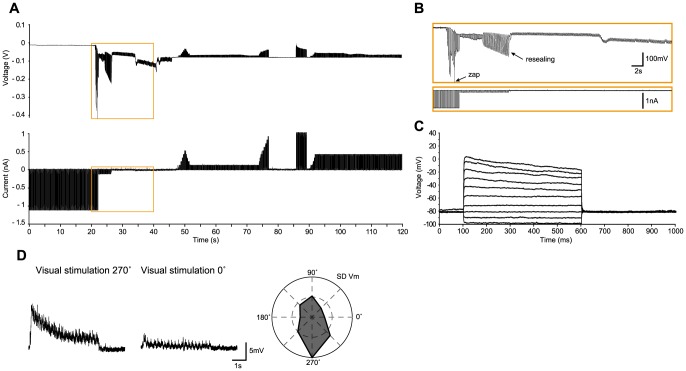
Figure 6. Glial cell in cat visual cortex in vivo recorded with the TZS method.
(A–B) As in Figure 2, voltage and current recordings during the approach to the cell and subsequent whole-cell access. Here, an initial spontaneous seal with a subsequent “zap” was accomplished, but in distinction to the TZ endpoints illustrated in Figures 2, 3 and 5, the membrane resealed (between 24 and 27 seconds), and whole-cell access was re-established by suction at ∼46 seconds (not visible in (B)). (C) Voltage responses to current steps (100 nA increments from −200 to 700 nA). (D) Left – Preferred (270°) and non-preferred (0°) voltage responses (average of 10 trials) to a moving sinusoidal grating (4 Hz, 100% contrast, 5 second duration). Right – Average standard deviation of the visual responses (over the 10 trials) as a function of stimulus direction, showing that this cell is tuned to stimulus direction, with a small bias for stimulus orientation. The on-line corrected Ra was 40 MΩ, which was validated off-line. The input resistance was 99 MΩ, giving a relative Ra of 0.40.

