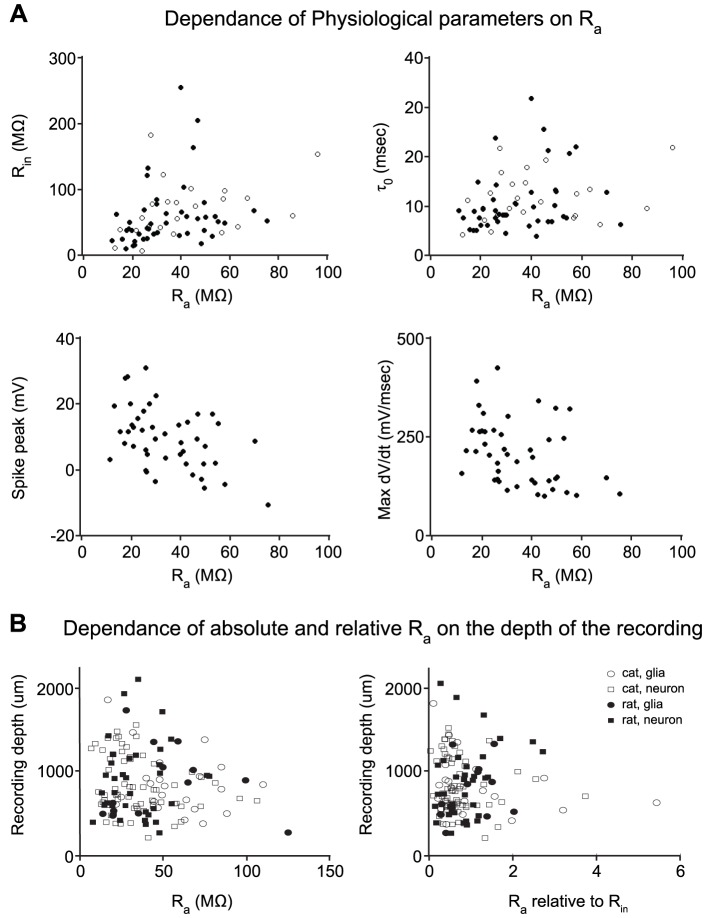
Figure 9. Neuron parameter dependencies on estimated access resistance Ra.
(A) Rat neurons closed circles, cat neurons open circles; Top left, cell input resistance versus Ra (r2 = 0.08). Top right, cell membrane time constant versus Ra (r2 = 0.06). Bottom left, peak spike voltage for regular-spiking neurons versus Ra (r2 = 0.22). Bottom right, peak spike depolarization for regular-spiking neurons versus Ra (r2 = 0.14). (B) Dependence of absolute and relative Ra on recording depth. Left, absolute value of Ra. Right, Ra normalized to the cell input resistance Rin. Pearson correlation coefficients (r2) are calculated over the entire dataset in each plot.

