
Figure 6. Differential gene expression of core clock genes in normal- and H-Ras-transformed human keratinocytes.
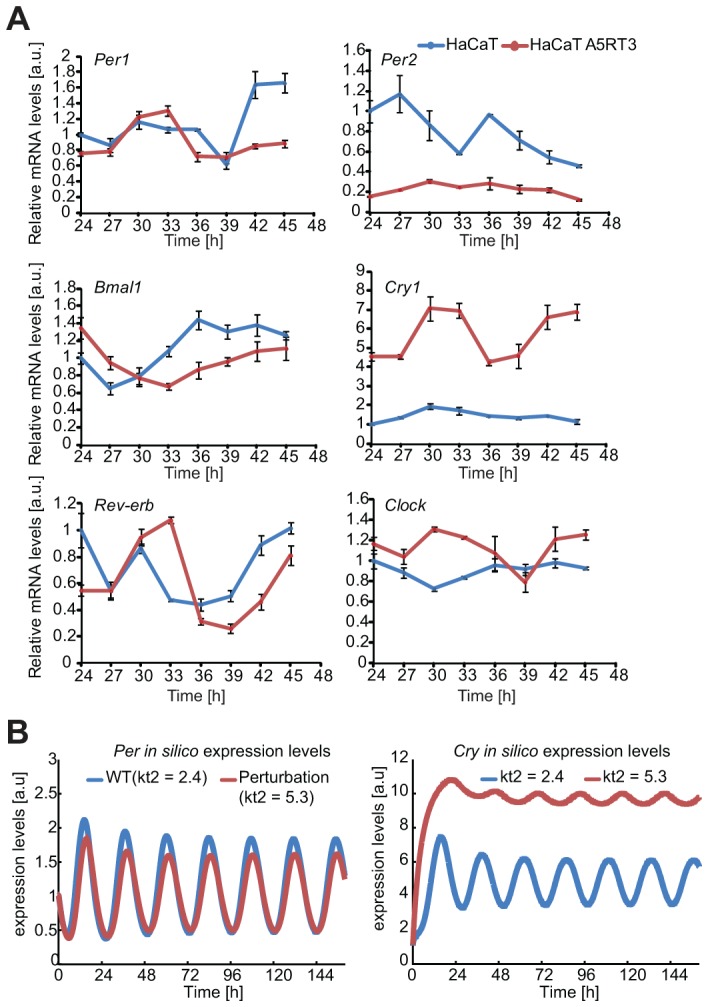
(A) HaCaT and H-Ras transformed HaCaT A5RT3 cells were synchronized with dexamethasone and after 24 hours harvested in regular 3-hour intervals Cry1 and Per2 gene expression magnitudes (relative to Gapdh) in HaCaT and HaCaT A5RT3 cells were significantly different (p<0.001, Mann-Whitney U-test). Shown are means and SEM of three independent experiments. (B) Shown are in silico expression profiles for Per and Cry obtained from simulations with our model over approximately 6 days. The blue curve represents the wild type (WT) non-perturbed situation (τ = 23 hours) and the red line represents the result of a single parameter perturbation (τ = 23.7 hours).