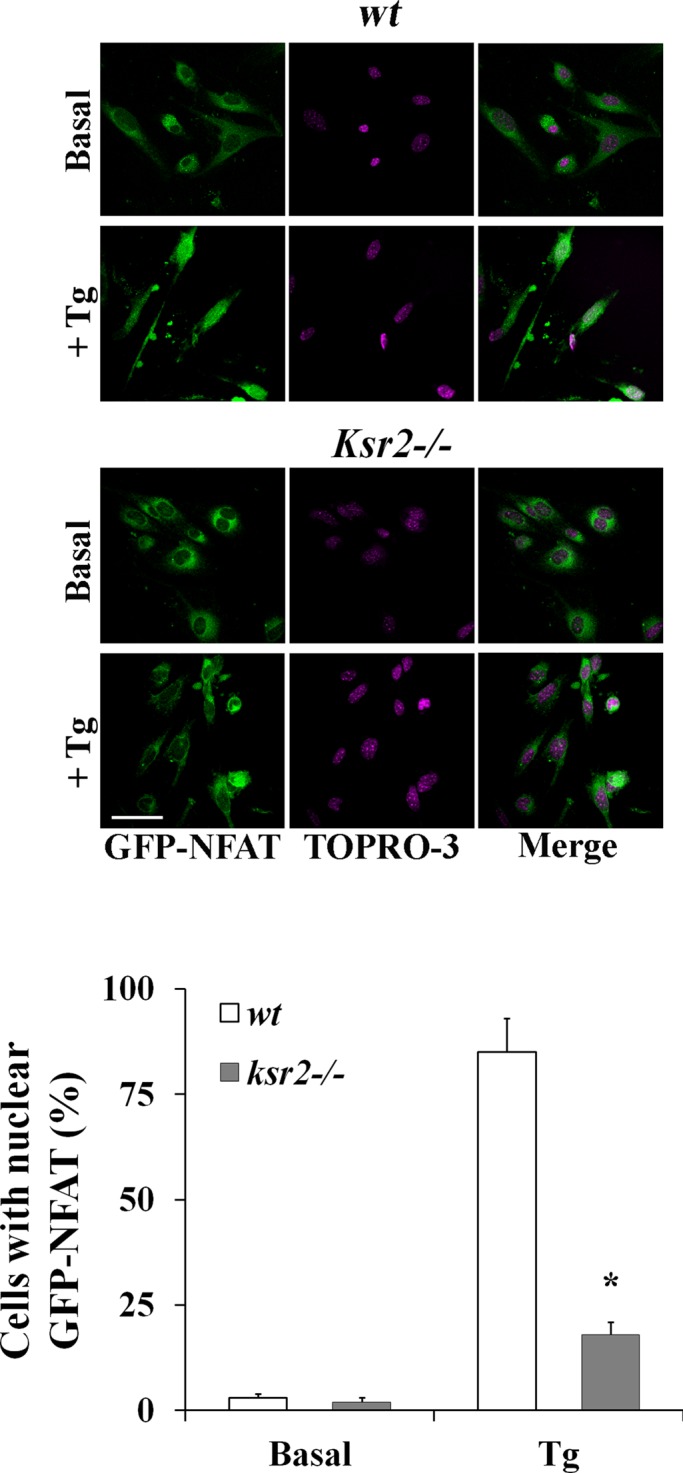
FIGURE 7:

KSR2 is required for CN activation. (A) Confocal microscopy of NFAT nuclear translocation in wt (top) and ksr2−/− (bottom) fibroblasts expressing GFP-NFAT (green) and stimulated without (basal) or with 1 μM Tg for 30 min followed by TO-PRO-3 staining of the nucleus (purple). The merge of NFAT and TO-PRO-3 staining (right) shows the NFAT translocation into the nucleus in wt cells. Representative cells for each condition of three experiments is shown. Quantitative analysis (mean ± SD) of wt and ksr2−/− cells with nuclear GFP-NFAT before and after stimulation with Tg from three experiments is shown in the graph bars. *p < 0.01. Bar, 5 μm.
