FIGURE 5:
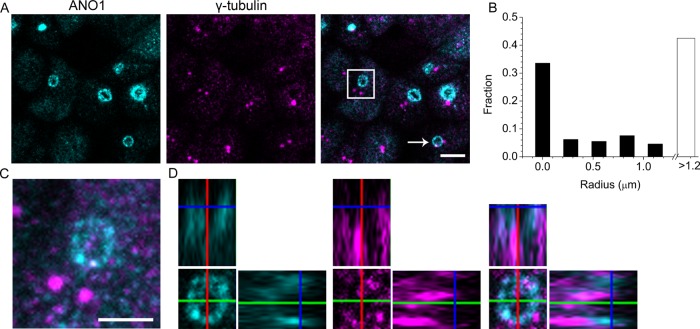
Relationship of the centriole to the ANO1 nimbus. (A) A maximum-intensity projection of a z-stack of confocal images of mpkCCD14 cells, showing that the spatial relationship of nimbi (ANO1, cyan) to centrioles (γ-tubulin, magenta) is variable. Some nimbi have centrioles within their boundary (white arrow), whereas others do not (white box). (B) Quantification of the distance of centrioles from ANO1 nimbi. ANO1 nimbi and centrioles were identified by thresholding using Cell Profiler. The leftmost bar indicates the fraction of ANO1 nimbi having at least one centriole completely contained within the perimeter in the maximum intensity projection (33%). Another 24% of the ANO1 nimbi had centrioles within <1.2 μm. Forty-three percent of rings did not have a centriole within 1.2 μm. (C) High-magnification image of the nimbus boxed in A. Puncta of γ-tubulin (magenta) are evident in the nimbus (ANO1, cyan), despite the remote location of the centrioles to the nimbus. (D) Individual ortho slices through the nimbus show that γ-tubulin in the nimbus partially overlaps with ANO1. Scale bar, 5 μm (A), 2.5 μm (C).

