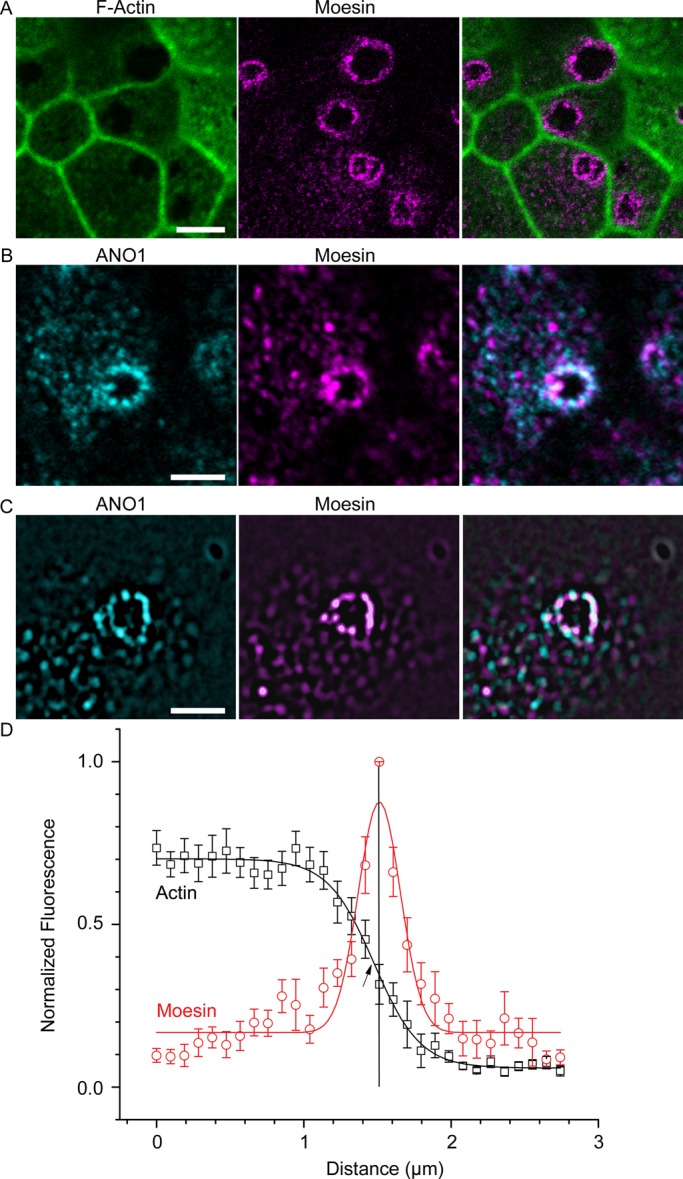
FIGURE 7:

Moesin marks the boundary of an F-actin–free zone that coincides with the ANO1 nimbus. (A) F-actin (green) concentration is lower in the center of the nimbus, and the interface between F-actin–free and F-actin–rich zones is defined by moesin (magenta) labeling. (B) Confocal image of mpkCCD14 cell nimbus showing that ANO1 (cyan) and moesin (magenta) occupy overlapping locations in the nimbus. (C) Structured illumination microscopy of ANO1 (cyan) and moesin (magenta) shows that the ANO1 and moesin rings comprise distinct puncta that are irregularly superimposed. (D) Quantification of moesin distribution relative to F-actin. To measure the relationship between moesin and F-actin labeling, pixel intensities along a line starting near the center of the cell and ending at the approximate center of a nimbus were recorded and normalized to the highest intensity in each channel. These measurements for 12 nimbi were then aligned on the x-axis to the moesin pixel with the highest intensity (= 1, vertical line) and the actin (black data points) and moesin (red data points) intensities averaged at each position on the x-axis. The moesin data were fitted to a Gaussian function (red line), and the actin was fitted to a Boltzmann equation (black line). Because the moesin channels were aligned to the highest moesin pixel intensity in order to calculate the average of multiple nimbi, the peak moesin intensity is 1, whereas variation in actin intensities around each nimbus resulted in a maximum intensity <1. Scale bars, 5 μm (A), 2.5 μm (B, C).
