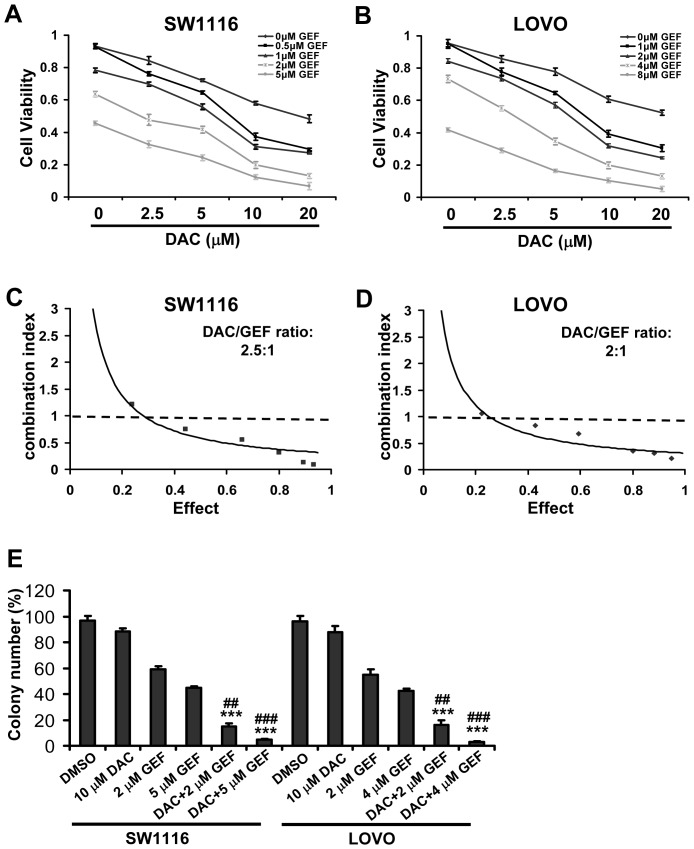
Figure 1. Synergistic antineoplastic effects of decitabine and gefitinib against colon cancer cells.
(A) and (B) SW1116 and LOVO cells were cultured in control conditions (DMSO) or in the presence of the indicated concentrations of decitabine (DAC) and gefitinib (GEF), alone or in combination, for 48 h, and then assessed for viability by MTT assay. Results are means of duplicate assessments from one out of three independent experiments. (C) and (D) SW1116 cells and LOVO cells were plated, treated, and processed as in A and B. The dose–response curve of each drug was determined and combination index (CI) values for DAC/GEF concentration ratios (2.5∶1 in SW1116 cells, 2∶1 in LOVO cells) were calculated according to the Chou–Talalay's method at the 48 h time point, with the biological response being expressed as the fraction of affected cells. Rectangle symbol and diamond symbol designate the CI value for each fraction affected (effect). CI<1, CI = 1, CI>1 indicate synergistic, additive and antagonistic effects, respectively. The effect ranges from 0 (no inhibition) to 1 (complete inhibition). The data are representative of three independent experiments. (E) Influence of SW1116 cells and LOVO cells on the number of colony-forming cells, as evaluated by clonogenic assay. For colony-forming assay, the clonogenic assay was done as described in materials and methods. Columns, mean of three determinations; bars, SD. Results shown are representative of three independent experiments. **, P<0.01, ***, P<0.001, compared with DAC-treated cells. ##, P<0.01, ###, P<0.001, compared with GEF-treated cells.

