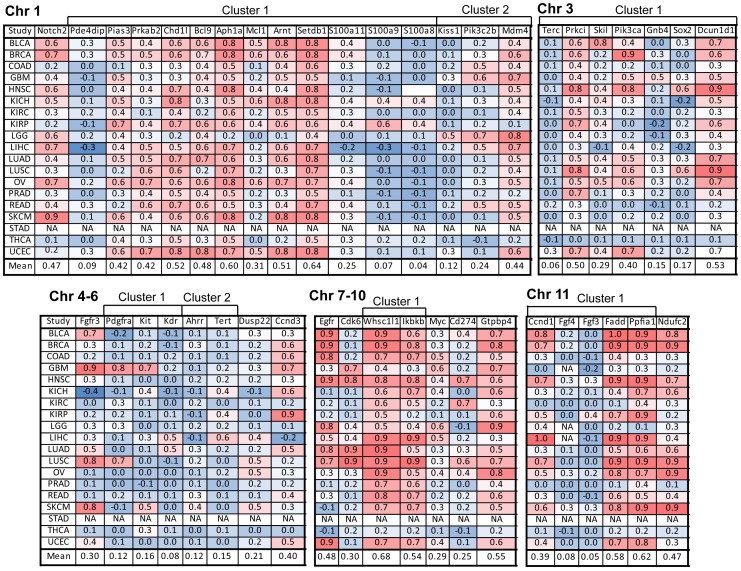
Figure 3. Gene copy number and mRNA expression correlation analysis to identify putative driver genes amplified on chromosomes 1–11.
Pearson correlation coefficients were calculated by analyzing gene copy number and mRNA expression from individual patient-derived samples in TCGA datasets. Shown are the correlation coefficients for each TCGA cancer subtype and the mean correlation across all cancer types (red denotes high correlation, blue denotes low correlation). Abbreviations of TCGA datasets are listed in Figure 1.

