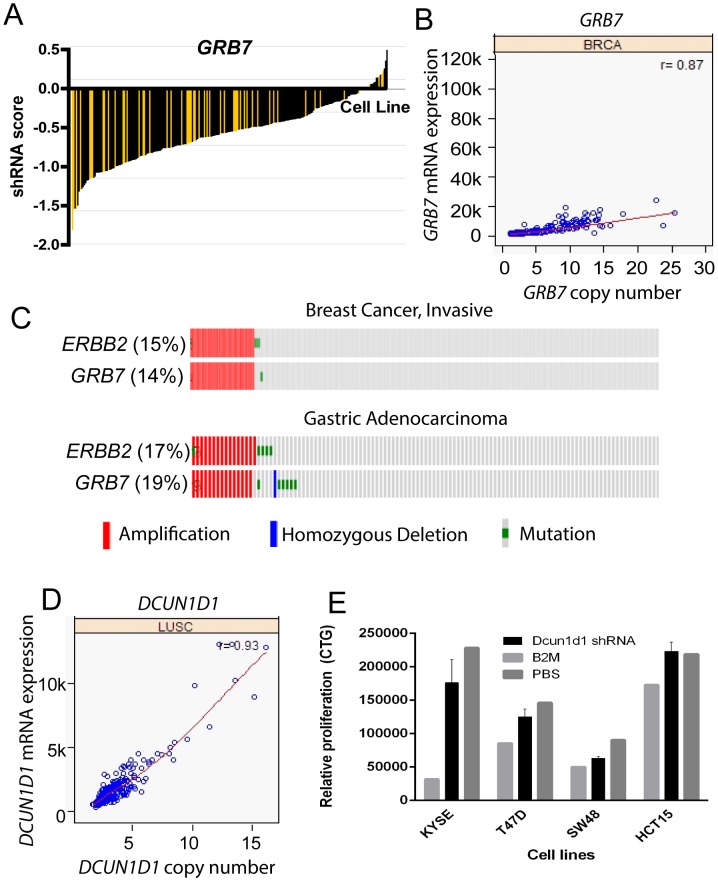
Figure 6. GRB7 and DCUN1D1 are novel cancer amplified genes with putative driver activity.
(A) GRB7 shRNA activity in a panel of cancer cell lines (Project Achilles). shRNA score denotes the log2 based decrease in GRB7 shRNA compared to pooled shRNA in cancer cell lines after several rounds of proliferation post-shRNA infection [11]. A negative shRNA score suggests decreased cancer cell proliferation/survival after shRNA transfection. Yellow bars indicate cell lines with GRB7 copy number >4 and black bars indicate cell lines with GRB7 copy number <4. (B) Copy number (x-axis) and mRNA expression (y-axis) for GRB7 in a panel of breast cancers. Correlation coefficient for copy number and mRNA expression are listed in the top right (r value). (C) Frequency of amplification (red bar), mutation (green bar), and deletion (blue bar) for GRB7 and ERBB2 in various cancers. The percentages shown reflect the overall rate of gene amplification, mutation and/or deletion in each cancer type. Vertical aligned bars reflect samples from the same patient. (D) Copy number (x-axis) and mRNA expression (y-axis) for DCUN1D1 in lung squamous cancers. Correlation coefficient for copy number and mRNA expression is listed in the top right (r value). (E) Relative proliferation (y-axis) of cancer cell lines KYSE, T47D, SW48, and HCT15 cells 6 days after infection with DCUN1D1 lentiviral shRNA particles, as measured by Cell Titer Glo assay.

