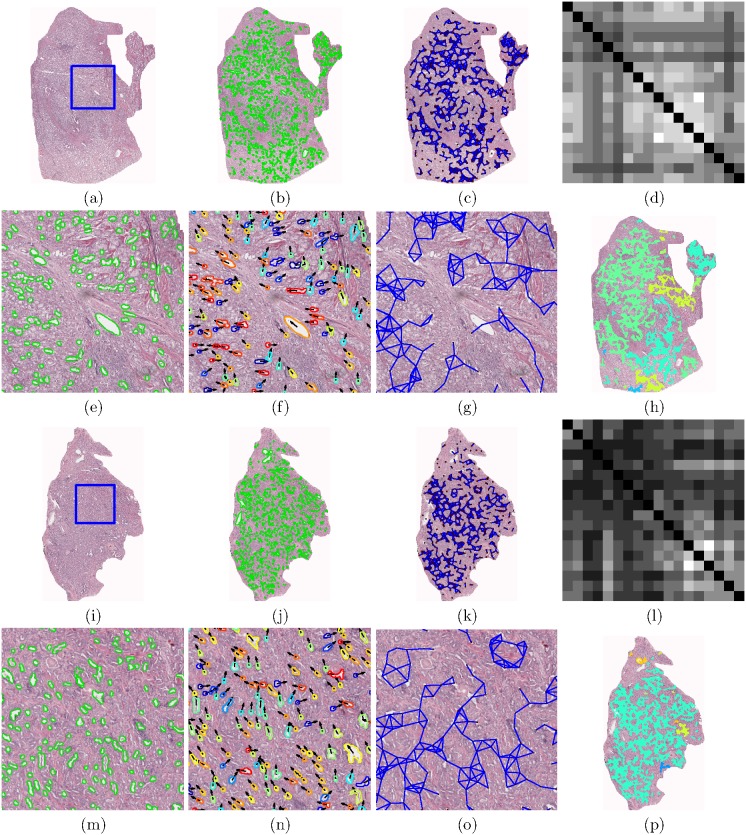
Figure 2. Annotated histological CaP regions ((a) and (i)) pertaining to a BCR (a)–(h) and a NR (i)–(p) case study, respectively.
(b), (j) Automated gland segmentation of gland boundaries. (c), (k) Subgraphs showing connections between neighboring glands. An enlarged view of the boxed region in (a) and (i) respectively, illustrates (e), (m) segmented glands, (f), (n) gland angles, and (g), (o) gland network subgraphs. (f), (n) Arrows denote the directionality of each gland. Boundary colors (blue to red) correspond to angles  180°]. (g), (o) Localized gland networks define the region of each angular co-occurrence matrix. (d), (l) Summed angular co-occurrence matrices denote the frequency with which two glands of two directionalities co-occur across all neighborhoods (white elements reflect greater co-occurrence). Diagonal co-occurrence values have been omitted to provide better contrast compared to the off-diagonal components. (h), (p) Colormap of the gland subgraphs correspond to the intensity average in each neighborhood.

