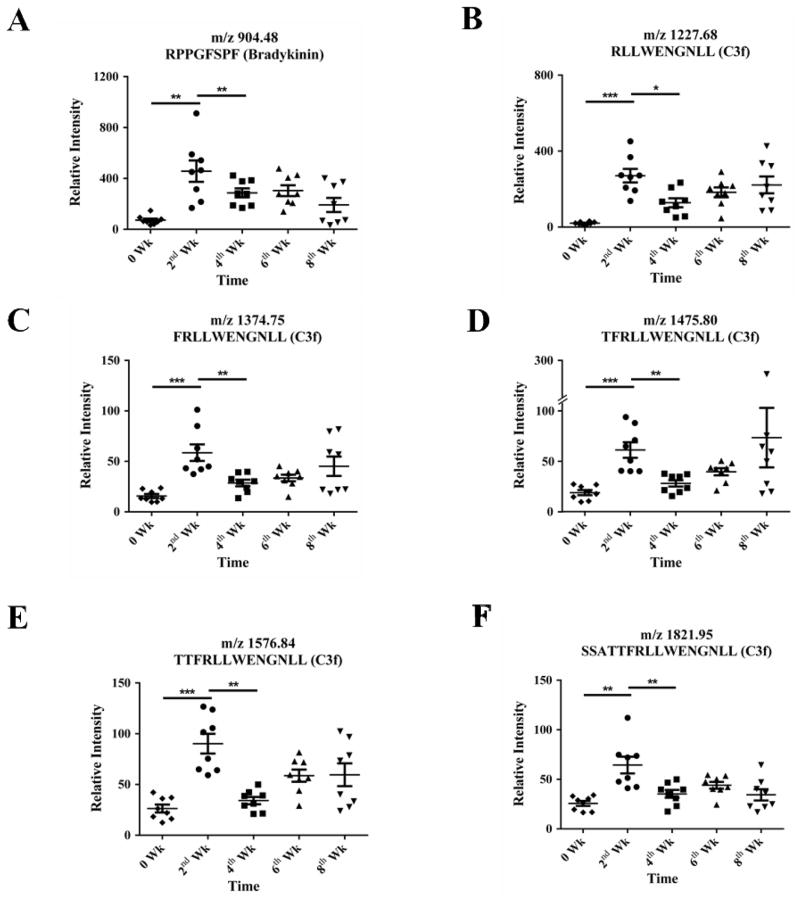
Figure 4. The vertical scattering plot of the normalized peak intensities in MALDI TOF MS for the potential peptide signatures in serum samples collected from tumor-bearing animals (breast cancer mouse model).
The mass-to-charge ratio and sequence identification is listed in each panel. Mouse number: n = 8; Student’s t-test, * p < 0.05, ** p < 0.01, *** p < 0.001.

