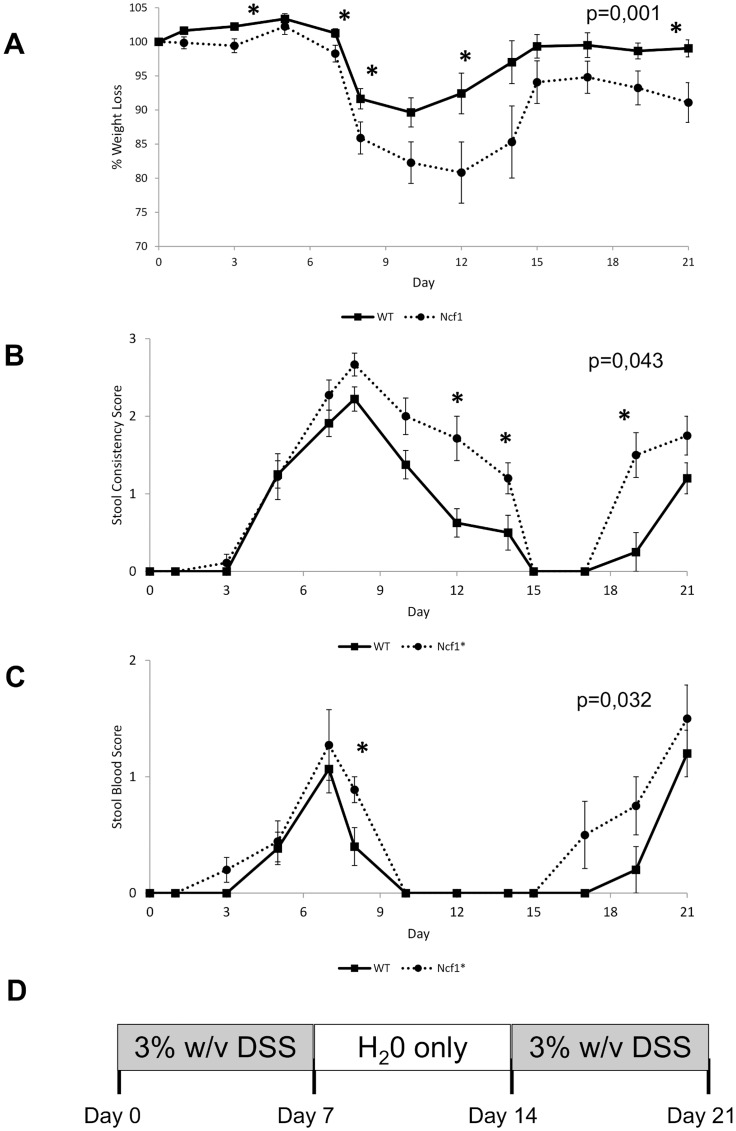
Figure 1. Clinical scores of colitis are more severe in Ncf1* mice.
A) Changes in average weight ± SE, (baseline weight: WT = 25.8±0.5 g, Ncf1* = 26.5±0.8 g). B) Changes in stools consistency ± SE. C) Presence of blood in stools ± SE. Asterisks indicate p<0.05, Mann-Whitney test between Ncf1* and WT. P-values on the top right corner indicate the statistical difference between curves, permutation test. D) Schematic overview of the DSS treatment plan showing the induction and recovery periods.

