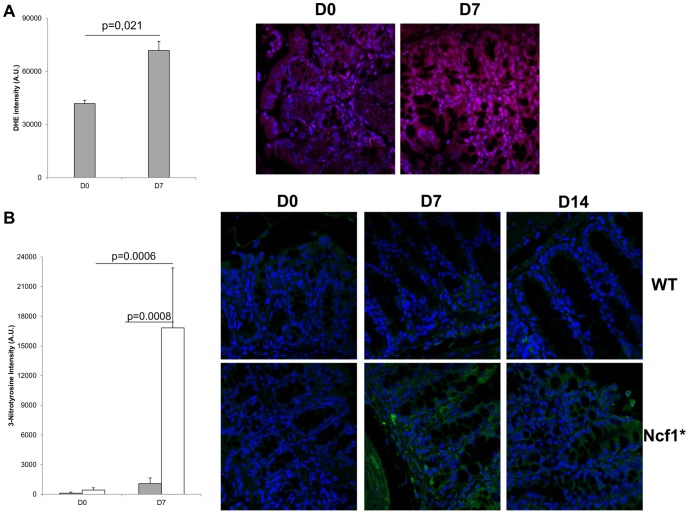
Figure 5. ROS levels increase in WT mice colonic inflammatory infiltrates after colitis induction, whereas Ncf1* mice increase the local production of peroxynitrites, which remains high after the recovery period.
A) Relative DHE fluorescence intensity in colon sections of WT mice, Mann-Whitney test. B) Representative fluorescence immunohistochemistry of local ROS (red) production in WT mice before and after colitis induction (magnification 400×). C) Relative 3-nitrotyrosin residues fluorescence intensity in colon sections of WT (grey bars) and Ncf1* mice (white bars), Mann-Whitney test. D) Representative fluorescence immunohistochemistry of peroxynitrites (green) production in the colonic inflammatory infiltrates in WT and Ncf1* mice (magnification 400×).

