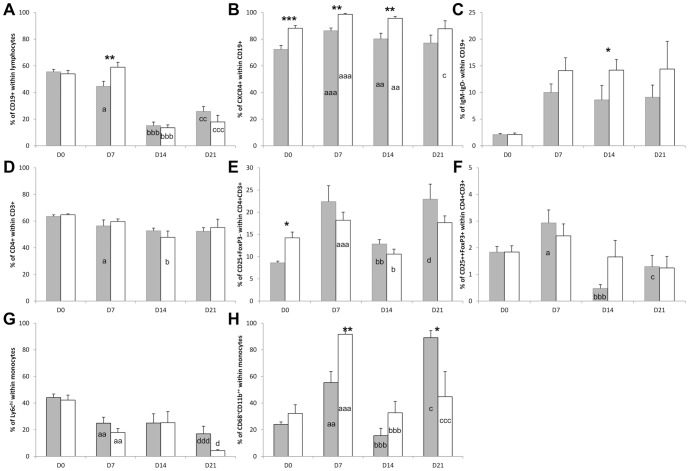
Figure 6. Analysis of peripheral blood functional leukocyte subsets at the different phases of DSS-colitis induction shows altered frequencies of circulating B and CD4+ T lymphocytes and CD11b+ monocytes between Ncf1* and WT mice.
A) Frequency of CD19+ B lymphocytes within total lymphocytes. B) Frequency of CXCR4+ cells within CD19+ B lymphocytes. C) Frequency of IgM−IgD− cells within CD19+ B lymphocytes. D) Frequency of CD4+ T lymphocytes within CD3+ T lymphocytes. E) Frequency of CD25+FoxP3− cells within CD4+ T lymphocytes. F) Frequency of CD25+FoxP3+ cells within CD4+ T lymphocytes. G) Frequency of Ly6chi cells within CD11b+ monocytes. H) Frequency of CD68+CD11b++ cells within CD11b+ monocytes. * indicates p<0.05 and ** indicates p<0.01, Mann-Whitney test between Ncf1* and WT; differences between days 0 and 7 are indicated by a: p<0.05, aa: p<0.01, aaa: p<0.001; differences between days 7 and 14 are indicated by b: p<0.05, bb: p<0.01, bbb: p<0.001; differences between days 7 and 21 are indicated by c: p<0.05, cc: p<0.01, ccc: p<0.001; differences between days 14 and 21 are indicated by d: p<0.05, dd: p<0.01, ddd: p<0.001, all Mann-Whitney test. White bars Ncf1*, gray bars WT.

