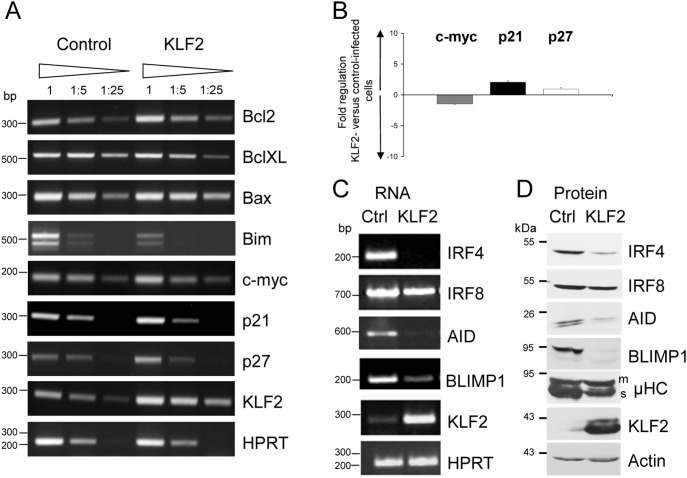
Figure 4. Enforced KLF2 expression blocks the activation of LPS-stimulated primary splenic B cells.
(A, B) PCR analyses of cell cycle and apoptotic regulators in LPS-stimulated, control- and KLF2-infected, GFP+-sorted splenic B cells with transcript specific primers 48 h after infection. HPRT signals control the integrity and amount of cDNA. (A) Serial dilutions of the respective cDNAs were used as templates. Fragments of a DNA bp standard are indicated to the left. Representative results of three independent experiments are shown. (B) qPCR analyses of c-myc, p21 and p27 transcript levels. Bar graphs indicate the mean fold change (+/− SEM) of the respective transcript in KLF2-infected GFP+ compared to control-infected GFP+ splenic B cells 48 h after infection. The fold change of transcript abundance was calculated from four independent experiments. RT-PCR (C) and Western Blot analyses (D) of activation-related molecules in control- (Ctrl) and KLF2-transduced (KLF2), GFP+-sorted splenic B cells 48 h after infection. KLF2 abundance served as a control for ectopic expression, whereas Actin abundance served as a control for equal amounts of loaded protein. Fragments of a protein standard, in kDa, are indicated. Representative results of two independent cell sorts with subsequent Western Blot experiments are shown.

