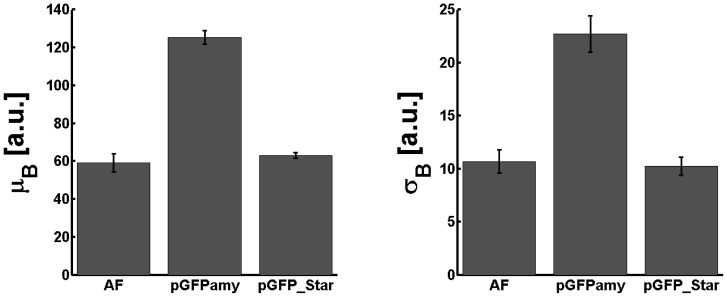
Figure 4. Mean fluorescence and standard deviation of pGFP_Star are reduced to autofluorescence level.
Average mean fluorescence (left) and average standard deviation (right) obtained from the fluorescence distributions of the autofluorescence (AF) of B. subtilis 168 parental strain and cells transformed with pGFPamy or pGFP_Star “empty” vectors at OD600nm of 5. Results include data of four independent experiments involving two separate clones. Error bars indicate the standard error of the mean.

