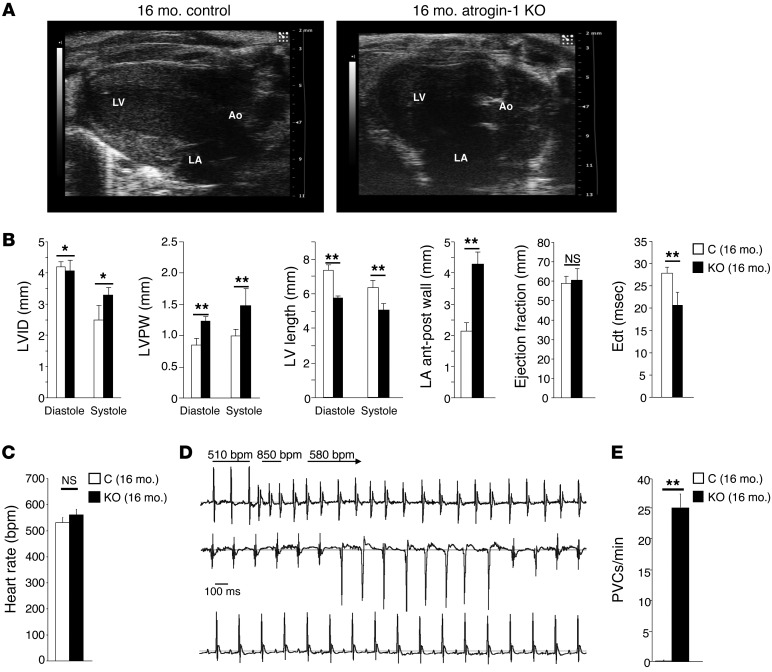
Figure 2. Aged atrogin-1 KO mice show impaired heart function.
(A) Echocardiographic long-axis view of 16-month-old control and atrogin-1 KO hearts. Ao, aorta. (B) Quantification of LV internal diameter (LVID), LV posterior wall (LVPW) thickness, LV length, LA anterior-posterior wall (LA ant-post wall), ejection fraction, and E wave deceleration time (EdT) in 16-month-old control and atrogin-1 KO mice. Error bars indicate SEM (*0.01 < P < 0.05; **P < 0.01; controls, n = 5 mice; atrogin-1 KO, n = 7 mice). (C) Quantification of heart rate (bpm) in freely moving aged control and atrogin-1 KO mice. Error bars indicate SEM (n = 4 mice for each group). (D) ECG recording in freely moving aged control (bottom) and atrogin-1 KO (top, 2 examples) mice. Atrogin-1 KO mice show runs of ventricular tachycardia. Estimation of heart rate is reported in the first ECG trace from an atrogin-1 KO mouse. (E) Quantification of ventricular ectopies per minute in aged control and atrogin-1 KO mice. Error bars indicate SEM (**P < 0.01; n = 4 mice for each group). PVC, premature ventricular complexes.

