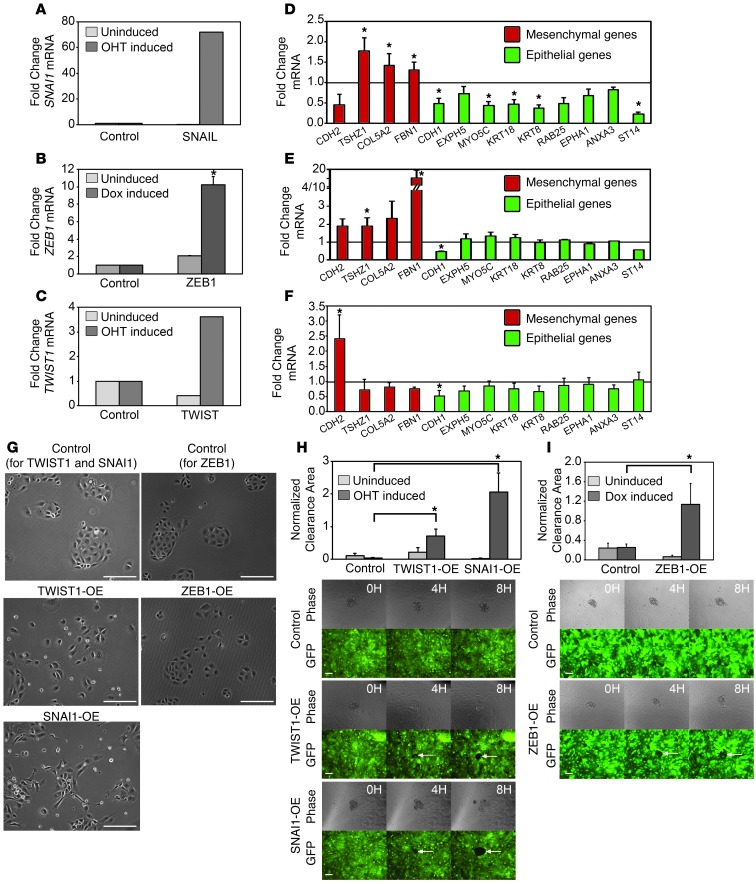
Figure 2. Overexpression of EMT transcription factors increases mesothelial clearance ability.
(A–C) qRT-PCR measurements of mRNA levels of (A) SNAI1, (B) ZEB1, or (C) TWIST1 in MCAS cells infected with the control WZL-empty vector, WZL-TWIST, or WZL-SNAI1 or MCAS rTTA cells infected with control FUW-LPT2 or FUW-LPT2 ZEB1. TWIST1 and SNAI1 cells were treated with vehicle (uninduced) or 20 nM 4-OHT, while ZEB1 cells treated with vehicle or 1 μg/ml doxycycline. (D–F) qRT-PCR measurements of mRNA levels of EMT markers in (D) TWIST1-, (E) ZEB1-, or (F) SNAI1-overexpressing cells. Measurements were normalized to RPLPO mRNA levels and expressed as fold changes compared to controls. Data are shown as the mean of 3 biological replicates for each condition. Each biological replicate was derived from an average of 3 technical replicates. (G) Phase-contrast images of control, TWIST1-, ZEB1-, and SNAI1-overexpressing MCAS cells induced with 20 nM 4-OHT or 1 μg/ml doxycycline for 7 to 14 days. Original magnification, ×10. (H and I) Normalized average clearance area of ZT mesothelial monolayers 8 hours after coculture with uninduced and 20 nM 4-OHT– or 1 μg/ml doxycycline-induced MCAS spheroids carrying control WZL-empty vector, inducible WZL-TWIST, WZL-SNAIL, control FUW-LPT2, or FUW-LPT2 ZEB1 expression vectors. >20 spheroids averaged per condition. Error bars denote SEM. *P < 0.05, Student’s t test. Scale bar: 100 μm.

