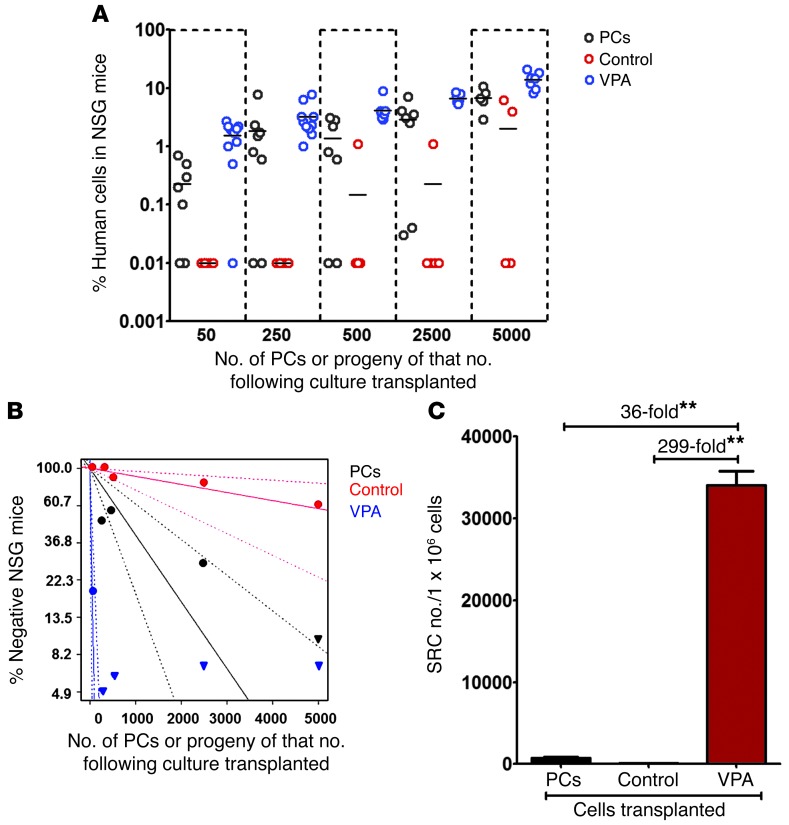
Figure 13. Comparison of the frequency of SRCs in PCs and the progeny of an equivalent number of CD34+ cells cultured under control conditions or treated with VPA.
(A) Increasing numbers of PCs (50, 250, 500, 2,500, and 5,000) and the progeny of cultures initiated with an equivalent number of cells cultured under control conditions or in the presence of VPA were individually transplanted into NSG mice. Percentage of human CD45+ cell engraftment in the BM of recipient mice after 12 to 13 weeks is shown. (B) Poisson statistical analysis was performed using the number of mice with or without evidence of human cell engraftment (Table 4). Graph represents the percentage of mice without human cell chimerism (negative) following the transplantation of PCs or the progeny of equivalent numbers of CD34+ cells from control cultures or cultures containing VPA. Dotted lines represent 95% CIs. (C) SRC numbers were calculated using Poisson statistical analysis and are represented as the number of SRCs per 1 × 10⁶ CD34+ cells. **P ≤ 0.002; ANOVA, P = 0.003. n = 111 NSG recipient mice.

