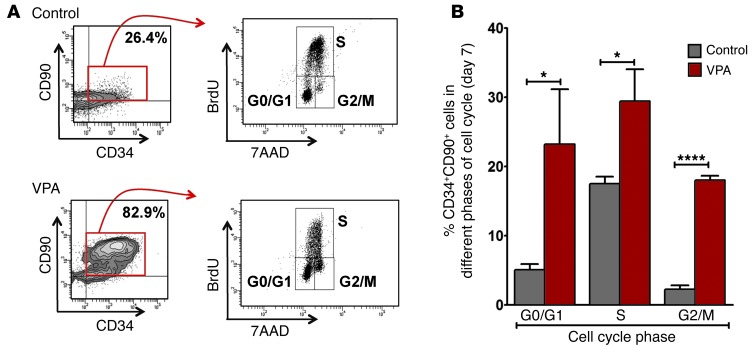
Figure 4. Effect of VPA on the different cell cycle phases of CD34+CD90+ cells.
(A) Flow cytometric cell cycle analysis of CD34+CD90+ cells following SF culture under control (upper panel: 26.4%) conditions or cultures containing VPA (lower panel: 82.9%) for 7 days, with corresponding dot plots showing cells in different phases of the cell cycle by BrdU pulse labeling (2.5 hours) and staining with 7AAD (G0/G1, S, and G2/M). One of three representative experiments is shown. (B) Percentage of CD34+CD90+ cells that were in different phases of the cell cycle. A significant increase in the number of CD34+CD90+ cells was observed in G0/G1 (*P < 0.05), S (*P < 0.05), and G2/M (****P < 0.0001) phases in the VPA-containing cultures (mean ± SD; ANOVA, P < 0.002; n = 3).

