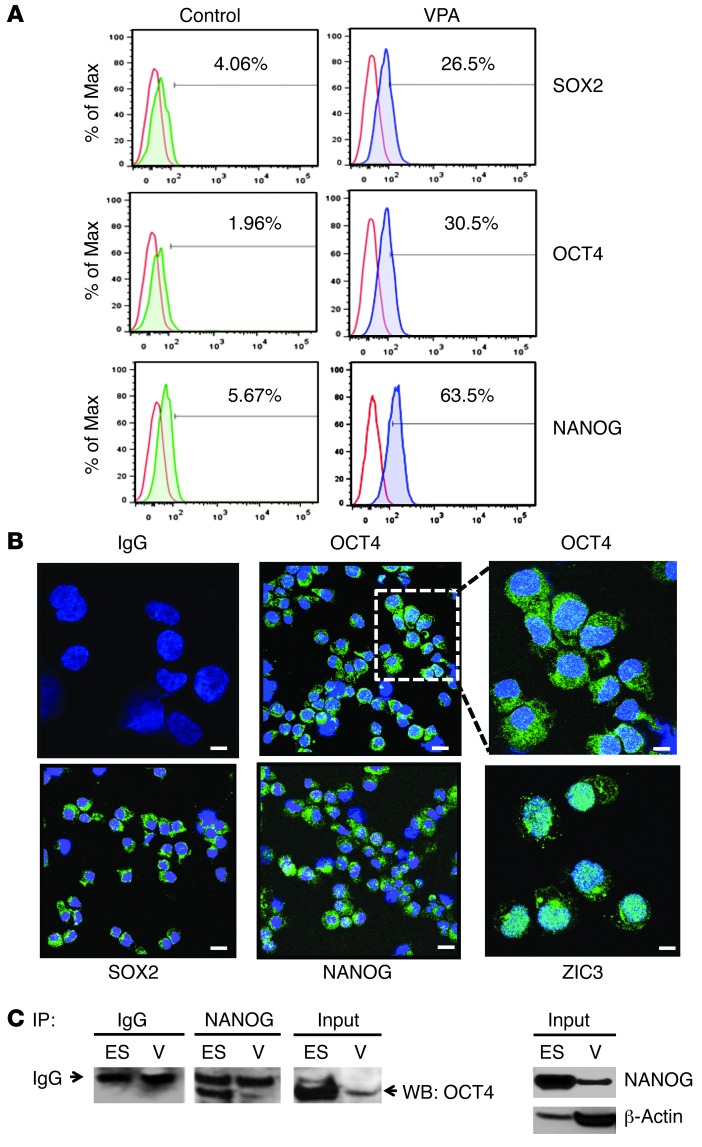
Figure 9. Expression of pluripotency genes in VPA-expanded CD34+ cells.
(A) Representative flow cytometric analysis of SOX2, OCT4, and NANOG expression in reisolated CD34+ cells after 7 days of culture under control conditions or after exposure to VPA. Cells were fixed, permeabilized, and stained with isotype-matched IgG (red line) or SOX2, OCT4, and NANOG mAbs to assess the intracellular levels of protein in reisolated CD34+ cells from control (green line) and VPA (blue line) cultures. One of four representative experiments is shown. (B) Confocal microscopic analysis of pluripotency gene expression. CD34+ cells were reisolated after treatment with VPA in SF cultures and immunostained with isotype-matched IgG or OCT4, SOX2, NANOG, and ZIC3 antibodies (FITC, green) as described in Methods. Nuclei were stained with DAPI (blue). Shown is a single optical section of confocal z-stack series (scale bars: 10 μm) for OCT4, SOX2, and NANOG (original magnification, ×63) and IgG and ZIC3, as well as a higher magnification (×126) of OCT4. One of three representative experiments is shown. (C) Co-IP of pluripotency genes. ES (H9) cells and progeny of the VPA-treated cells (V) were lysed on day 7, and ES or V cell lysates were IP with NANOG pAb (or anti-IgG control) and fractionated by SDS-PAGE. Total protein lysates (input) from ES and VPA-treated cells were also included in the same gel but were noncontiguous. Western blot (WB) analysis was performed using an OCT4 pAb. Western blot analysis using NANOG mAb was also performed on ES and VPA-treated cell lysates. β-Actin was used as a loading control. One of three representative experiments is shown.

