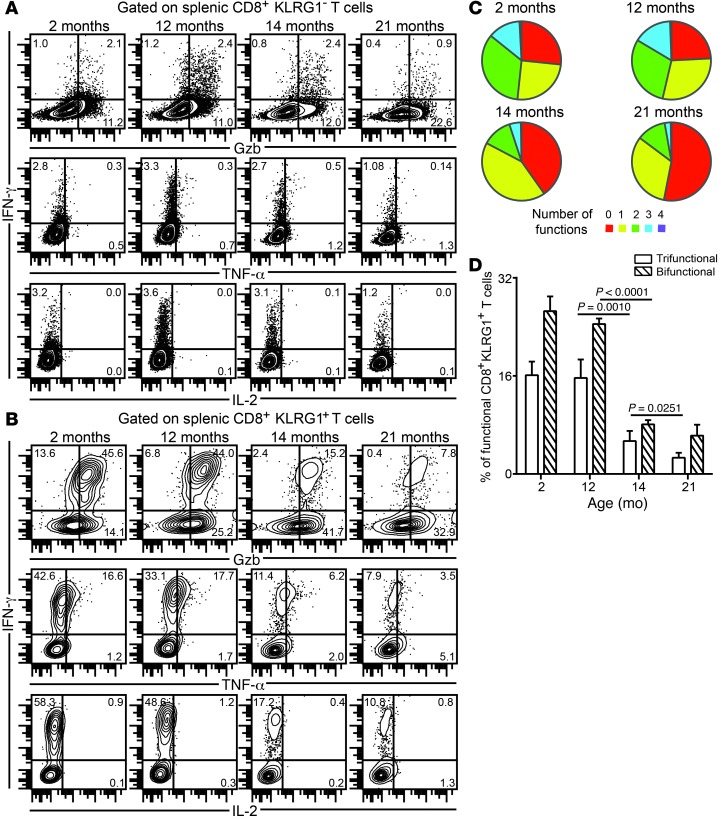
Figure 2. Downregulation of effector CD8+ T cell polyfunctionality in E. cuniculi–challenged aged mice.
(A and B) KLRG1– (A) and KLRG1+ (B) effector CD8+ T cells from mice at various ages were assayed for IFN-γ, Gzb, TNF-α, and IL-2 production at day 12 after infection. (C) Proportion of polyfunctional (IFN-γ, Gzb, TNF-α, and/or IL-2) KLRG1+ CD8+ T cells in these mice. (D) Percentage of KLRG1+ CD8+ T cells exhibiting 2 or 3 functions (IFN-γ, Gzb, and/or TNF-α), shown as bar graphs. Data represent 2 experiments with at least 4 mice per group. Numbers in dot plots denote percentage.

