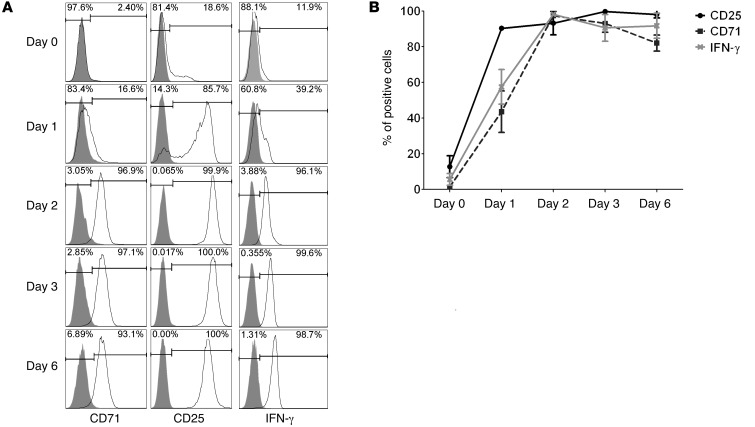
Figure 1. Screening of CD8+ Treg activation markers by flow cytometry.
(A) CD8+CD45RClo Tregs were isolated from the spleens of CD40Ig-treated rats by cell sorting and analyzed for their expression of T cell activation markers on day 0 and after 1 to 6 days of polyclonal stimulation with anti-CD3/CD28 antibodies. Gray-filled histograms represent the isotype control staining. (B) Data are summarized and plotted as the means ± SEM. n = 3.

