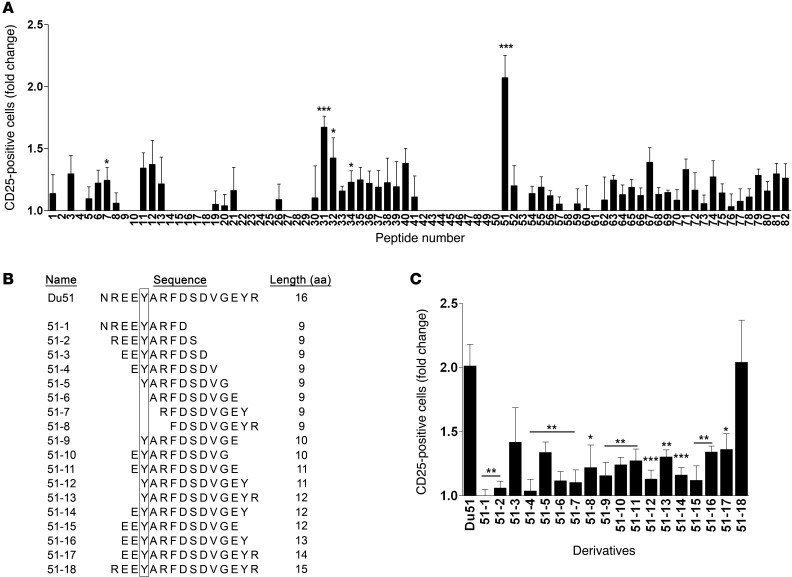
Figure 2. Analysis of CD8+CD45RClo Treg activation in response to donor-derived peptide stimulation.
(A) CD8+ Tregs were cocultured for 6 days with syngeneic CpG-matured pDCs in the presence of peptides. For each experiment, the percentage of CD25+ Tregs after 6 days of coculture with pDCs alone was given a value of 1. The mean value of 1 is equal to 32.85 ± 1.98%. Results are expressed as the ratio ± SEM between the percentage of CD25+ cells after peptide stimulation and the percentage of CD25+ cells in the control condition without peptide. *P < 0.05, **P < 0.01, and ***P < 0.001 versus control condition (value 1.0). n = 4–18 for each peptide. (B) Analysis of Treg activation in response to Du51 shorter peptide derivatives. On the left, 18 Du51 derivatives are detailed and classified by aa sequence length, from 9 aa to 15 aa. The box highlights mismatched aa between the donor and recipient. On the right, Treg activation in response to Du51 derivatives was analyzed by CD25 expression. CD8+ Tregs were cocultured for 6 days with syngeneic CpG-matured pDCs in the presence of each peptide. Bars represent the ratio between the percentage of CD25+ cells after peptide stimulation and the percentage of CD25+ cells in the control condition without peptide. *P < 0.05, **P < 0.01, and ***P < 0.001 versus Du51 condition. n = 3–14 for each peptide.

