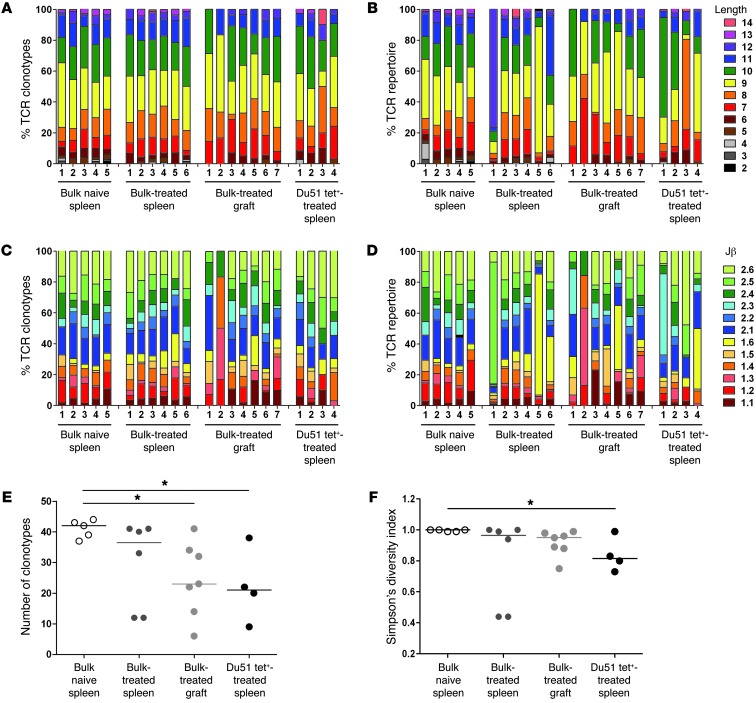
Figure 6. Features and diversity of Vβ11 TCR aa repertoires.
Comparison of the features (A–D) and diversity (E and F) of Vβ11 TCR aa repertoires obtained from CD8+CD45RClo Tregs from naive spleens, bulk or Du51 Tet+ CD8+CD40Ig Tregs from spleens, and GITCs from CD40Ig-treated grafts. Shown are the percentages of the TCRβ aa clonotypes (A and C) and the TCRβ repertoires (i.e., including clonal dominance) (B and D) for each naive and CD40Ig-treated animal using a particular CDR3 length (A and B) and Jβ gene (C and D). The number of TCR aa clonotypes (E) and Simpson’s diversity indices (F) were estimated for a sample size of 44 TCR sequences per individual repertoire. The diversity of the TCR repertoires in CD40Ig-treated animals was compared with that of naive animals using a Kruskal-Wallis test and Dunn’s multiple comparison post tests. *P < 0.05.

