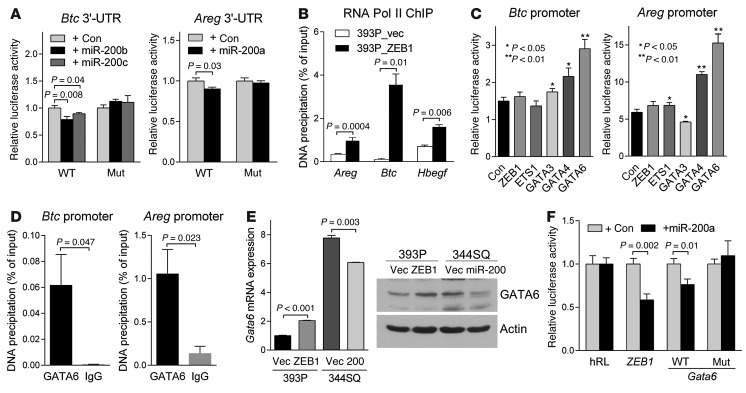
Figure 3. BTC and AREG are transcriptionally or post-transcriptionally regulated by the ZEB1/miR-200 axis.
(A) 3′-UTR reporter assays. 344SQ cells were transiently cotransfected with pre–miR-200s and Btc or Areg 3′-UTR luciferase reporters in which predicted miR-200 binding sites were wild-type (WT) or mutated (Mut). Results were normalized using a dual firefly/Renilla luciferase system. Mean ± SD from triplicate samples. (B) RNA polymerase II (Pol II) ChIP assays of Areg, Btc, and Hbegf promoters. Mean ± SD from triplicate samples. (C) GATA6 ChIP assays on Btc and Areg promoters. IgG was used as a negative control. (D) Promoter reporter assays. 393P cells were transiently cotransfected with Btc or Areg promoter luciferase reporters (500 ng/well in 24-well plates) and control or a GATA6 expression vector (500 ng). Mean ± SD from triplicate samples. (E) qPCR analysis (bar graph) and Western blot analysis (gels) of GATA6 expression. qPCR values, normalized on the basis of ribosomal protein L32 mRNA levels, represent the mean ± SD from triplicate samples and were expressed relative to 393P_vector cells (Vec), which were set at 1.0. Actin was included as a loading control. (F) 3′-UTR reporter assays. 344SQ cells were transiently cotransfected with pre–miR-200a and Gata6 3′-UTR luciferase reporters, in which predicted miR-200 binding sites were wild-type or mutated. Results were normalized using a dual firefly/Renilla luciferase system. ZEB1 3′-UTR was used as a positive control. Mean ± SD from triplicate samples. Results are expressed relative to the normalized luciferase activity in hRL-transfected (empty vector–transfected) cells.

