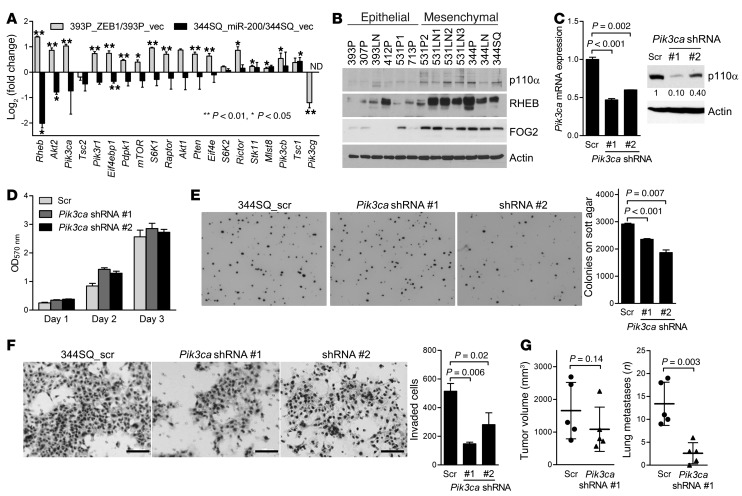
Figure 4. p110α mediates invasion and metastasis.
(A) qPCR analysis of the mRNA levels of genes in the PI3K pathway. Values were normalized on the basis of ribosomal protein L32 mRNA levels and are expressed as ratios (393P_ZEB1 to 393P_vector; 344SQ_miR-200 to 344SQ_vector). (B) Western blot analysis of KP cells. (C) qPCR assays (bar graph) and Western blot analysis (gels) of 344SQ_Pik3ca shRNA cells (shRNA #1 and #2) and 344SQ_scr shRNA cells (Scr). Controls include 344SQ_scr shRNA cells and blotting for actin. qPCR values were normalized on the basis of ribosomal protein L32 mRNA levels and represent the mean ± SD from triplicate samples. (D) Density of 344SQ_Pik3ca shRNA cells and 344SQ_scr shRNA cells in monolayer culture was measured by MTT assay at the indicated time points. Values represent the mean ± SD from triplicate samples. (E) Soft agar colony formation. Colonies were photographed (images) and counted (bar graph) after 14 days of incubation. Original magnification, ×4. Values represent the mean ± SD from triplicate wells. (F) Invasion assays. Cells were photographed (images) and quantified (bar graph). Scale bars: 100 μm. (G) Scatter plots of primary tumor volume (left scatter plot) and numbers of visible lung metastases (right scatter plot) in syngeneic mice injected in the flanks with 344SQ_Pik3ca shRNA (n = 5) or 344SQ_scr cells (n = 5). Each mouse is indicated with a dot. Mean ± SD calculated for each cohort.

